October 8th Crop Progress Report

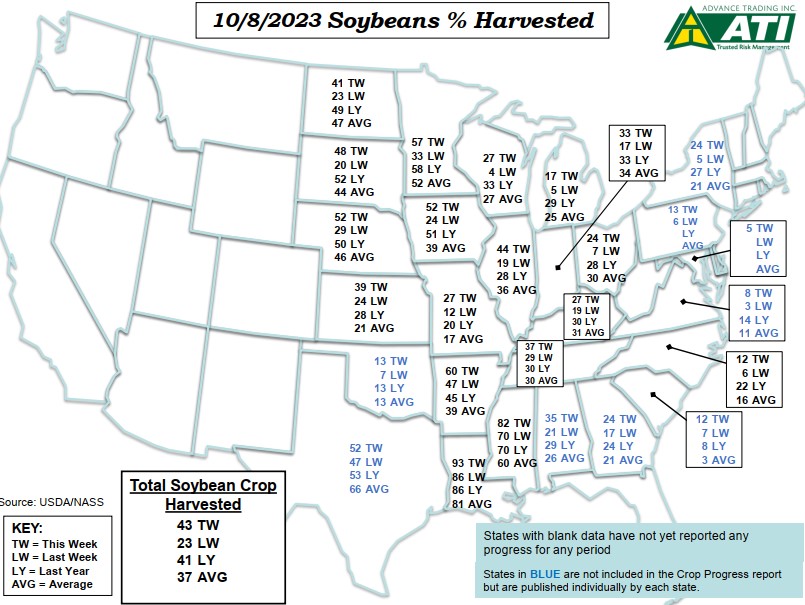
Corn and soybean harvest is moving forward slightly ahead of the 5-year average pace. Generally, progress is ahead of average in the western states and slightly behind average in eastern states. Corn harvest is 34% complete vs. 29% last year and 31% on average. Soybean harvest is 43% complete vs. 41% last year and 37% on average.
| Conditions (Good + Excellent) | |
| Corn Conditions | G/E: 53% TW vs. 53% LW, 52% LY |
| Soybean Conditions | G/E: 51% TW vs. 52% LW, 57% LY |
| Milo Conditions | G/E: 42% TW vs. 41% LW, 22% LY |
| Crop Progress Summary | |
| Corn Mature | 89% TW vs. 82% LW, 85% LY, 85% AVG |
| Corn Harvested | 34% TW vs. 23% LW, 29% LY, 31% AVG |
| Soybean Dropping Leaves | 93% TW vs. 86% LW, 90% LY, 87% AVG |
| Soybean Harvested | 43% TW vs. 23% LW, 41% LY, 37% AVG |
| Milo Mature | 81% TW vs. 70% LW, 78% LY, 78% AVG |
| Milo Harvested | 44% TW vs. 35% LW, 44% LY, 42% AVG |
| Winter Wheat Planted | 57% TW vs. 40% LW, 53% LY, 57% AVG |
| Winter Wheat Emerged | 29% TW vs. 15% LW, 24% LY, 30% AVG |
| Source: USDA/NASS |
Read the complete NASS report here
Graphics courtesy of Advance Trading Inc
October 1st Crop Progress Report
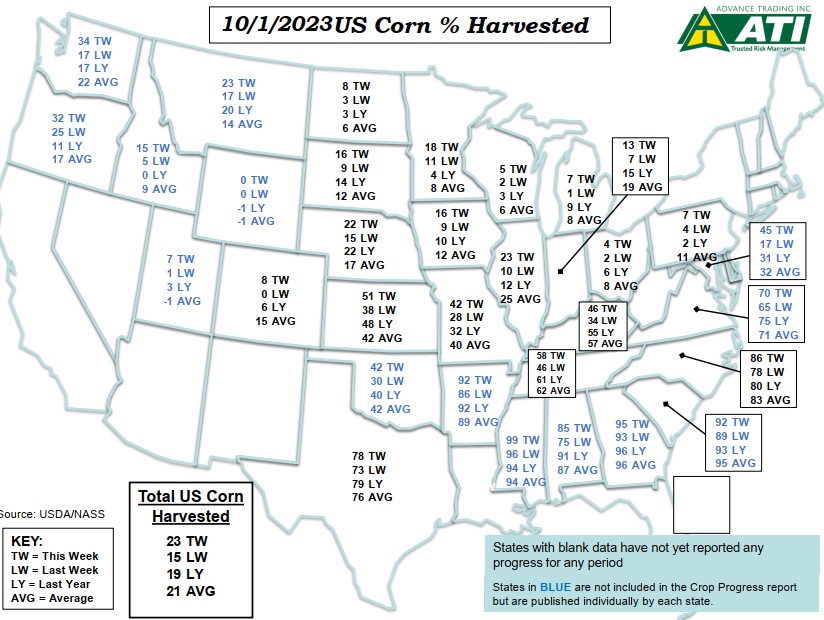
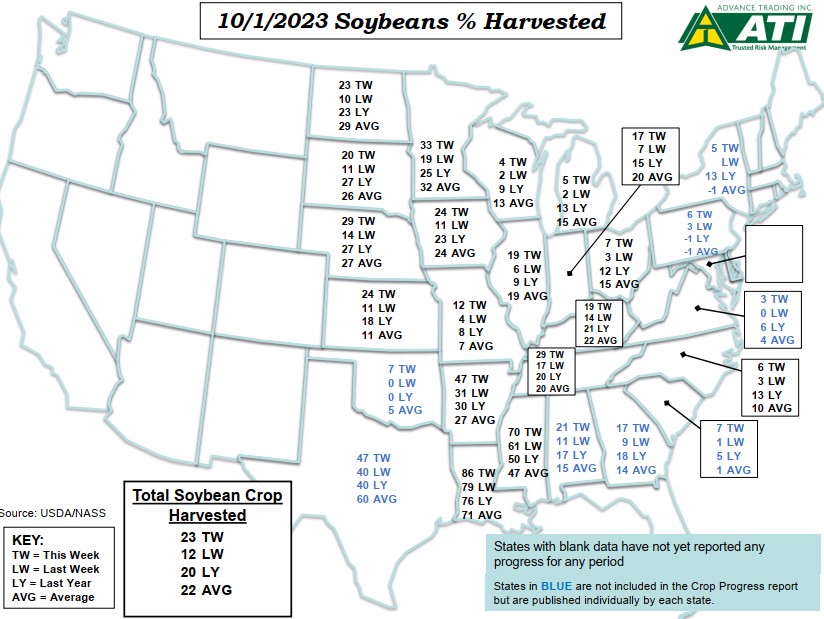
The 2023 corn and soybean harvest continues to move forward slightly ahead of the 5-year average pace. Corn harvest was reported 23% complete vs. 19% last year and 21% on average. The soybean harvest was reported 23% complete vs. 20% last year and 22% on average.
| Conditions (Good + Excellent) | |
| Corn Conditions | G/E: 53% TW vs. 53% LW, 52% LY |
| Soybean Conditions | G/E: 52% TW vs. 50% LW, 55% LY |
| Milo Conditions | G/E: 41% TW vs. 42% LW, 20% LY |
| Crop Progress Summary | |
| Corn Mature | 82% TW vs. 70% LW, 73% LY, 75% AVG |
| Corn Harvested | 23% TW vs. 15% LW, 19% LY, 21% AVG |
| Soybean Dropping Leaves | 86% TW vs. 73% LW, 78% LY, 77% AVG |
| Soybean Harvested | 23% TW vs. 12% LW, 20% LY, 22% AVG |
| Milo Coloring | 96% TW vs. 92% LW, 95% LY, 97% AVG |
| Milo Mature | 70% TW vs. 58% LW, 67% LY, 67% AVG |
| Milo Harvested | 35% TW vs. 28% LW, 33% LY, 34% AVG |
| Winter Wheat Planted | 40% TW vs. 26% LW, 39% LY, 43% AVG |
| Winter Wheat Emerged | 15% TW vs. 7% LW, 14% LY, 16% AVG |
| Source: USDA/NASS |
Read the complete NASS report here
Graphics courtesy of Advance Trading Inc.
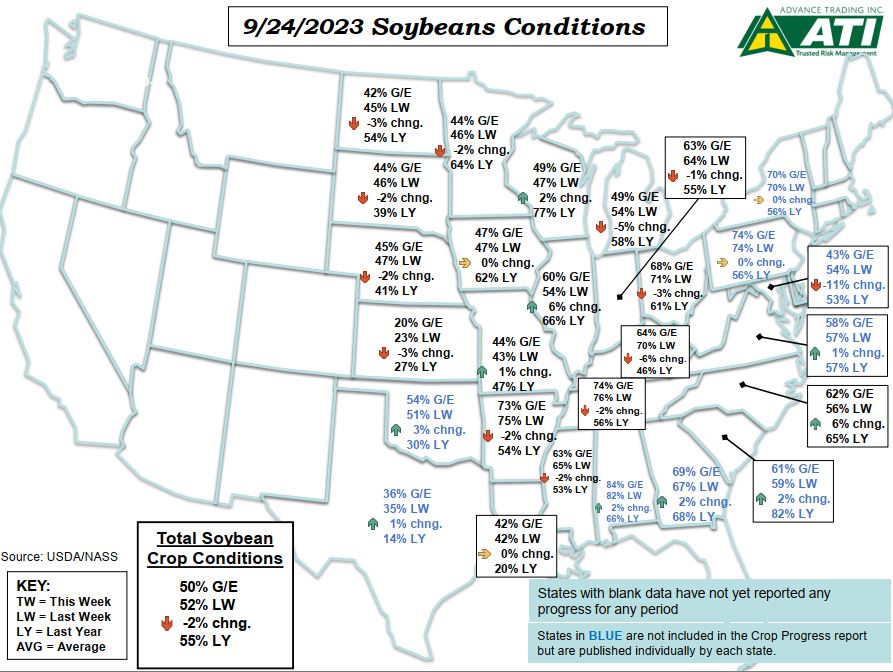
September 24th Crop Progress Report
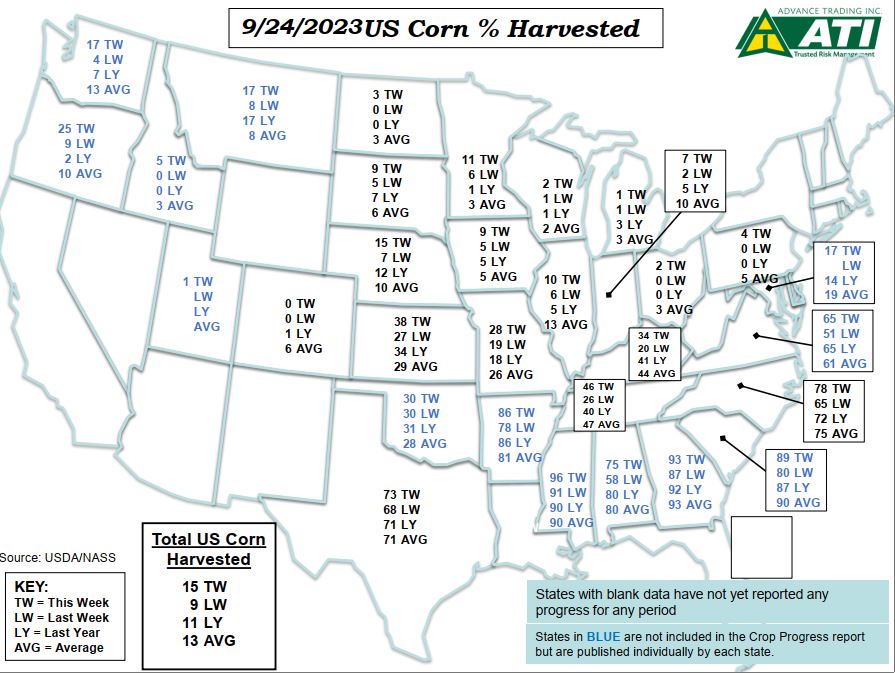
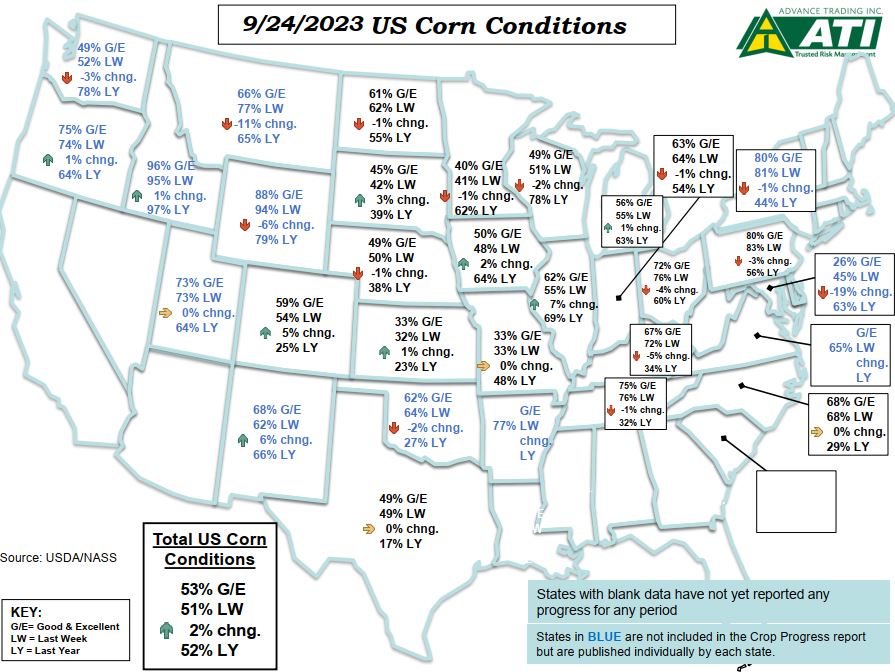
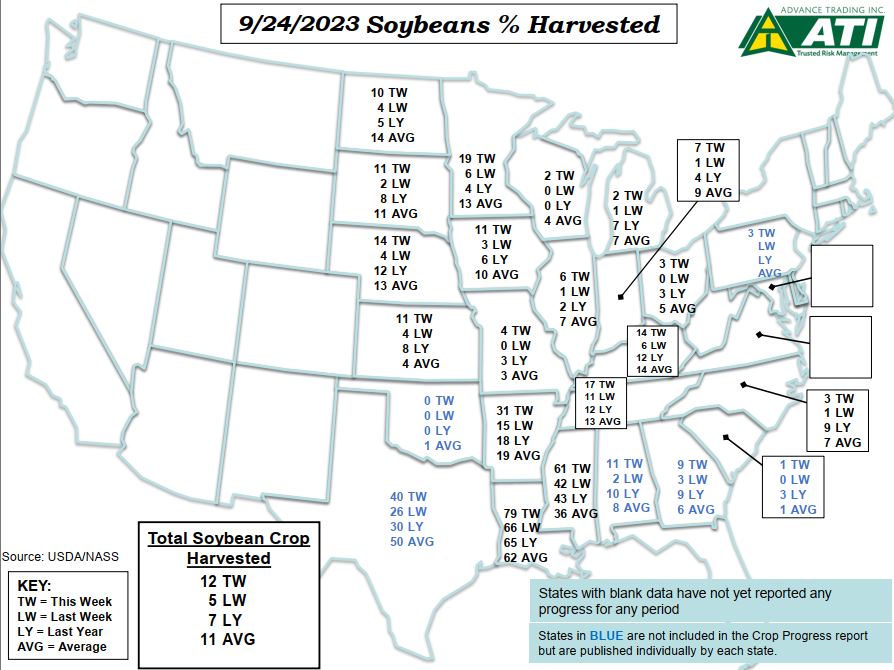
Now that we’re in late September, we turn our focus to the pace of harvest. While it’s early, similar to the whole growing season harvest progress is running ahead of the average pace. Corn harvested is at 15% complete vs. 11% last year and 13% on average. Soybean harvest is 12% complete vs. 7% last year and 11% on average.
| Conditions (Good + Excellent) | |
| Corn Conditions | G/E: 53% TW vs. 51% LW, 52% LY |
| Soybean Conditions | G/E: 50% TW vs. 52% LW, 55% LY |
| Milo Conditions | G/E: 42% TW vs. 43% LW, 22% LY |
| Crop Progress Summary | |
| Corn Dented | 95% TW vs. 90% LW, 91% LY, 93% AVG |
| Corn Mature | 70% TW vs. 54% LW, 55% LY, 60% AVG |
| Corn Harvested | 15% TW vs. 9% LW, 11% LY, 13% AVG |
| Soybean Dropping Leaves | 73% TW vs. 54% LW, 60% LY, 62% AVG |
| Soybean Harvested | 12% TW vs. 5% LW, 7% LY, 11% AVG |
| Milo Coloring | 92% TW vs. 85% LW, 90% LY, 93% AVG |
| Milo Mature | 58% TW vs. 47% LW, 54% LY, 54% AVG |
| Milo Harvested | 28% TW vs. 24% LW, 27% LY, 29% AVG |
| Winter Wheat Planted | 26% TW vs. 15% LW, 30% LY, 29% AVG |
| Winter Wheat Emerged | 7% TW vs. (NA)% LW, 8% LY, 6% AVG |
| Spring Wheat Harvested | 96% TW vs. 93% LW, 96% LY, 96% AVG |
| Source: USDA/NASS |
Read the complete NASS report here
Graphics courtesy of Advance Trading Inc.
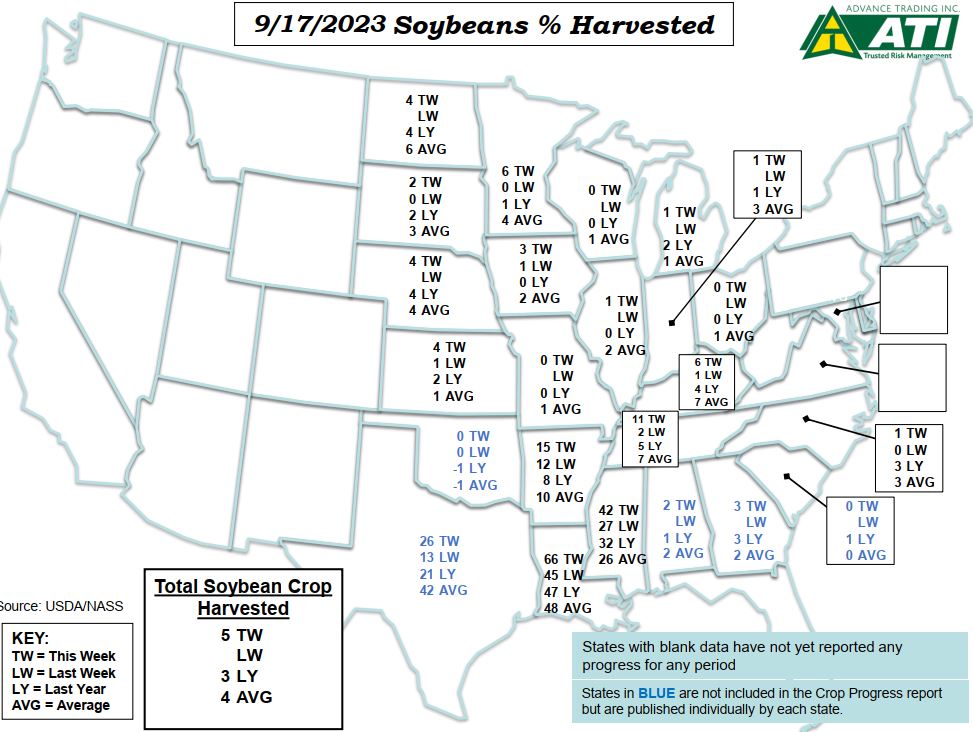
September 17th Crop Progress Report
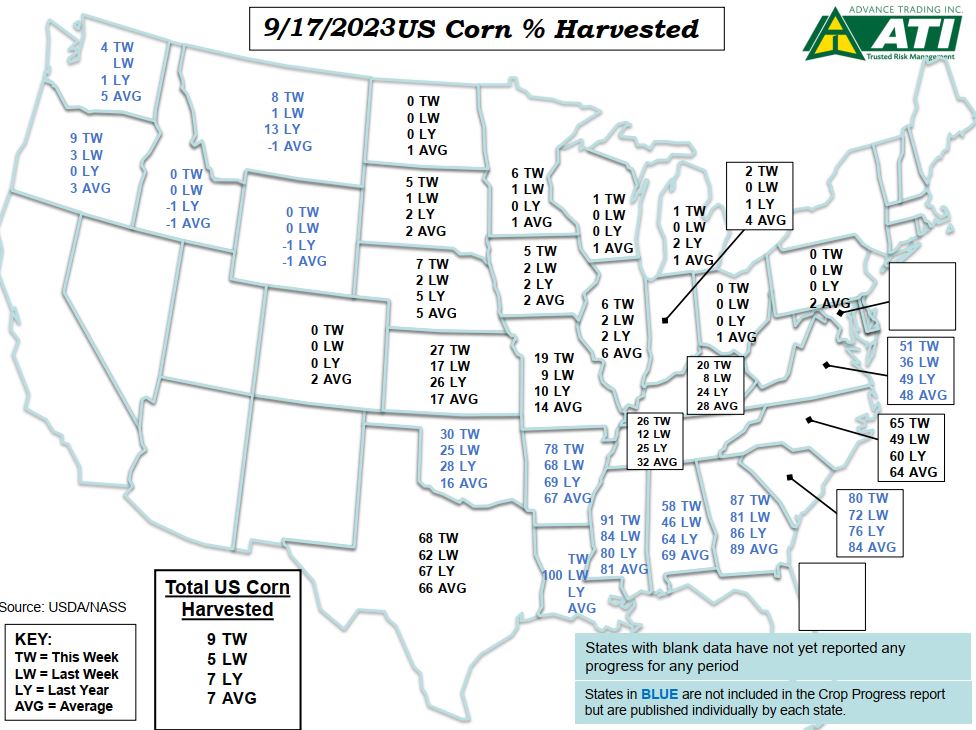
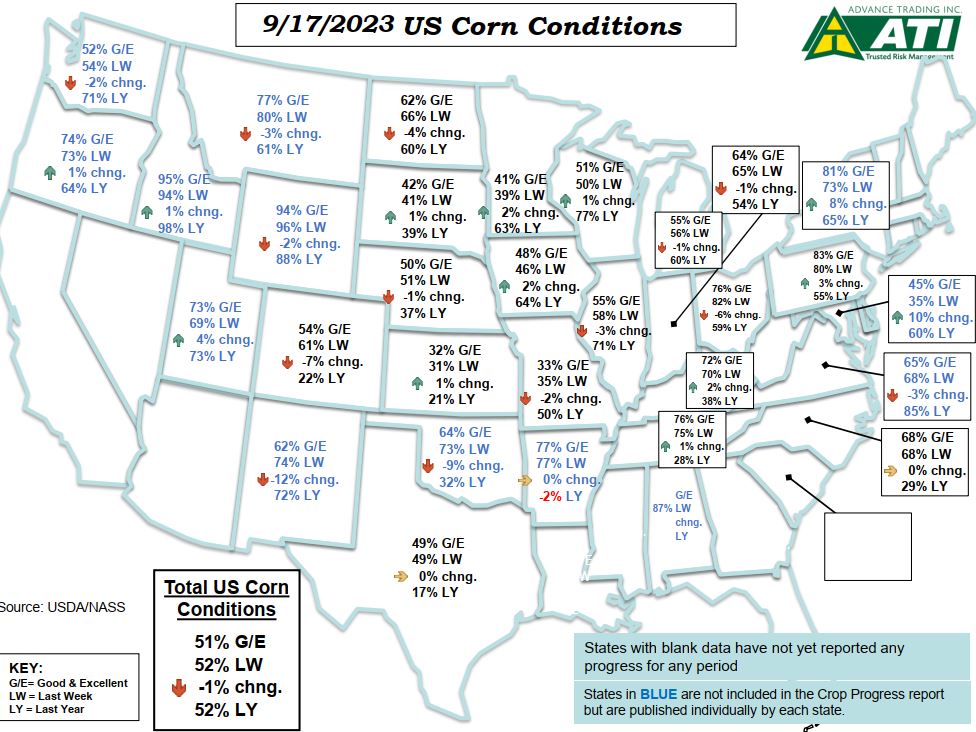

We’ve reached the point of the 2023 growing season where crop conditions are less important than what we find as harvest progresses.
Corn conditions declined 1% to 51% good-excellent and soybeans were steady at 52% good-excellent.
Corn harvest is at 9% complete and soybean harvest is 5% complete – both figures are slightly ahead of the 5-year average.
| Conditions (Good + Excellent) | |
| Corn Conditions | G/E: 51% TW vs. 52% LW, 52% LY |
| Soybean Conditions | G/E: 52% TW vs. 52% LW, 55% LY |
| Milo Conditions | G/E: 43% TW vs. 44% LW, 20% LY |
| Crop Progress Summary | |
| Corn Dented | 90% TW vs. 82% LW, 86% LY, 87% AVG |
| Corn Mature | 54% TW vs. 34% LW, 38% LY, 44% AVG |
| Corn Harvested | 9% TW vs. 5% LW, 7% LY, 7% AVG |
| Soybean Dropping Leaves | 54% TW vs. 31% LW, 39% LY, 43% AVG |
| Soybean Harvested | 5% TW vs. (NA)% LW, 3% LY, 4% AVG |
| Milo Coloring | 85% TW vs. 74% LW, 83% LY, 87% AVG |
| Milo Mature | 47% TW vs. 37% LW, 43% LY, 43% AVG |
| Milo Harvested | 24% TW vs. 21% LW, 24% LY, 25% AVG |
| Winter Wheat Planted | 15% TW vs. 7% LW, 19% LY, 16% AVG |
| Spring Wheat Harvested | 93% TW vs. 87% LW, 93% LY, 93% AVG |
| Source: USDA/NASS |
Read the complete NASS report here
Graphics courtesy of Advance Trading Inc
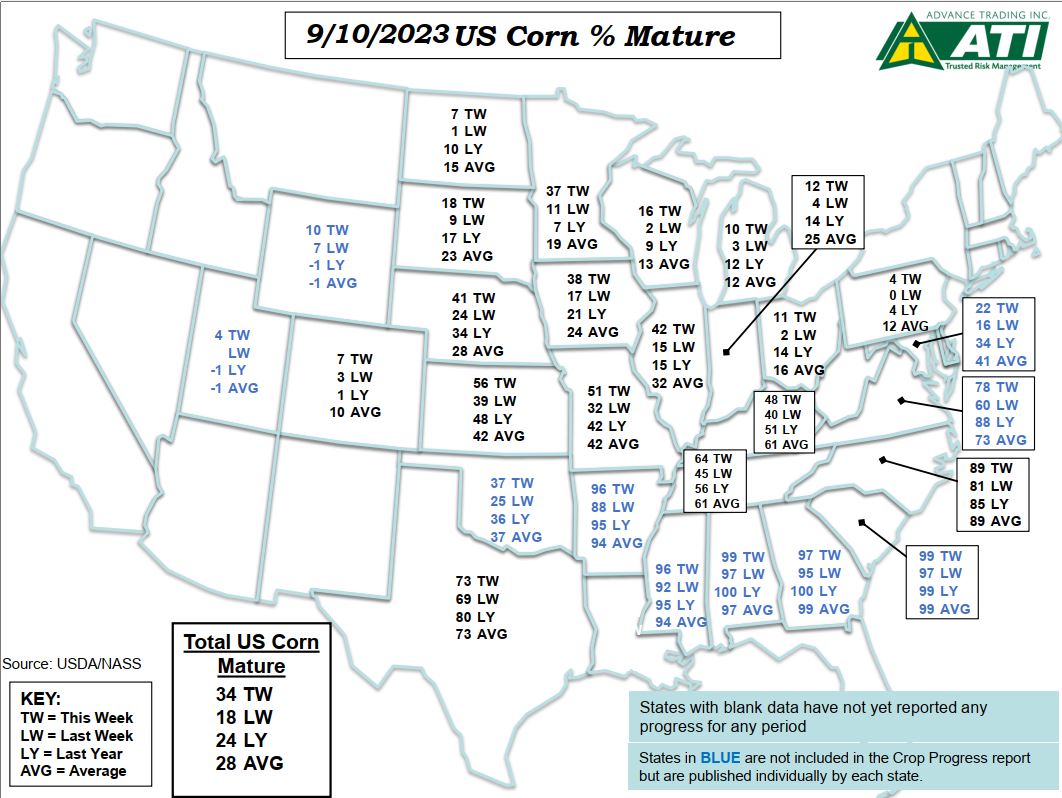
September 10th Crop Progress Report
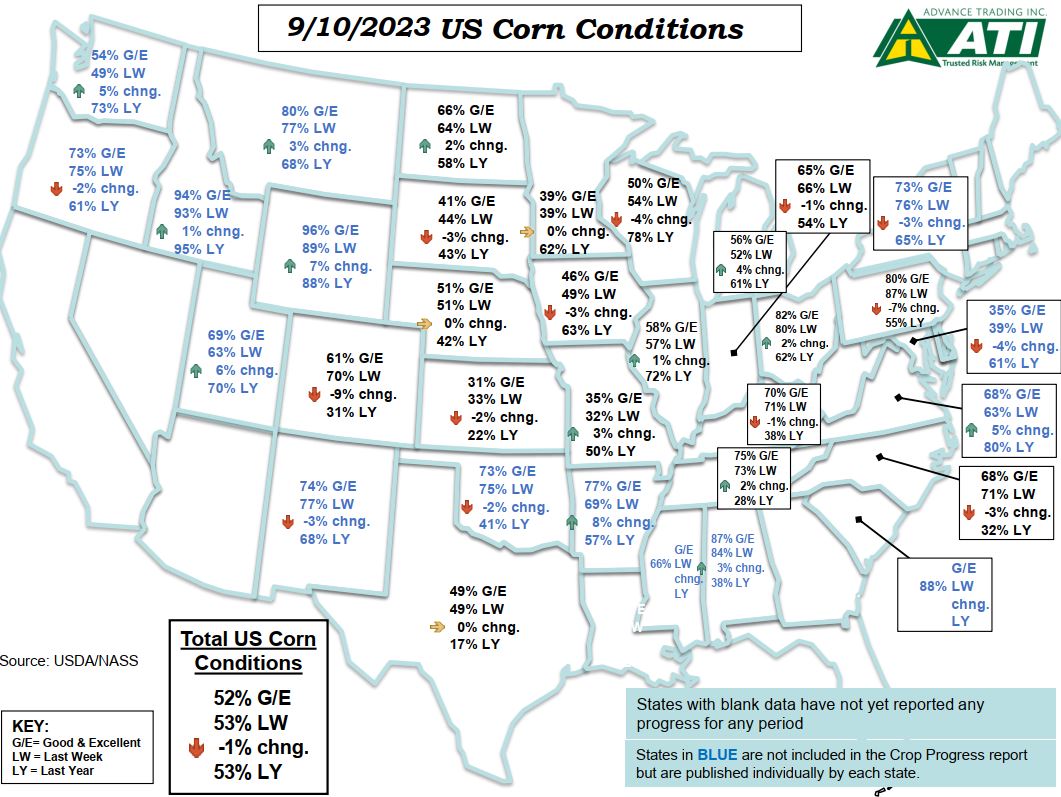

Crop conditions fell a little more in this week’s report. Corn conditions slipped to 52% good-excellent vs. 53% last week and 53% last year. Soybean conditions also dropped to 52% good-excellent vs. 53% last week and 56% last year.
The corn and soybean crops have been advancing at a pace ahead of average all year and soon harvest data will provide the ultimate crop ratings.
| Conditions (Good + Excellent) | |
| Corn Conditions | G/E: 52% TW vs. 53% LW, 53% LY |
| Soybean Conditions | G/E: 52% TW vs. 53% LW, 56% LY |
| Milo Conditions | G/E: 44% TW vs. 44% LW, 20% LY |
| Crop Progress Summary | |
| Corn Dough | 97% TW vs. 93% LW, 95% LY, 96% AVG |
| Corn Dented | 82% TW vs. 67% LW, 75% LY, 78% AVG |
| Corn Mature | 34% TW vs. 18% LW, 24% LY, 28% AVG |
| Corn Harvested | 5% TW vs. (NA)% LW, 5% LY, 4% AVG |
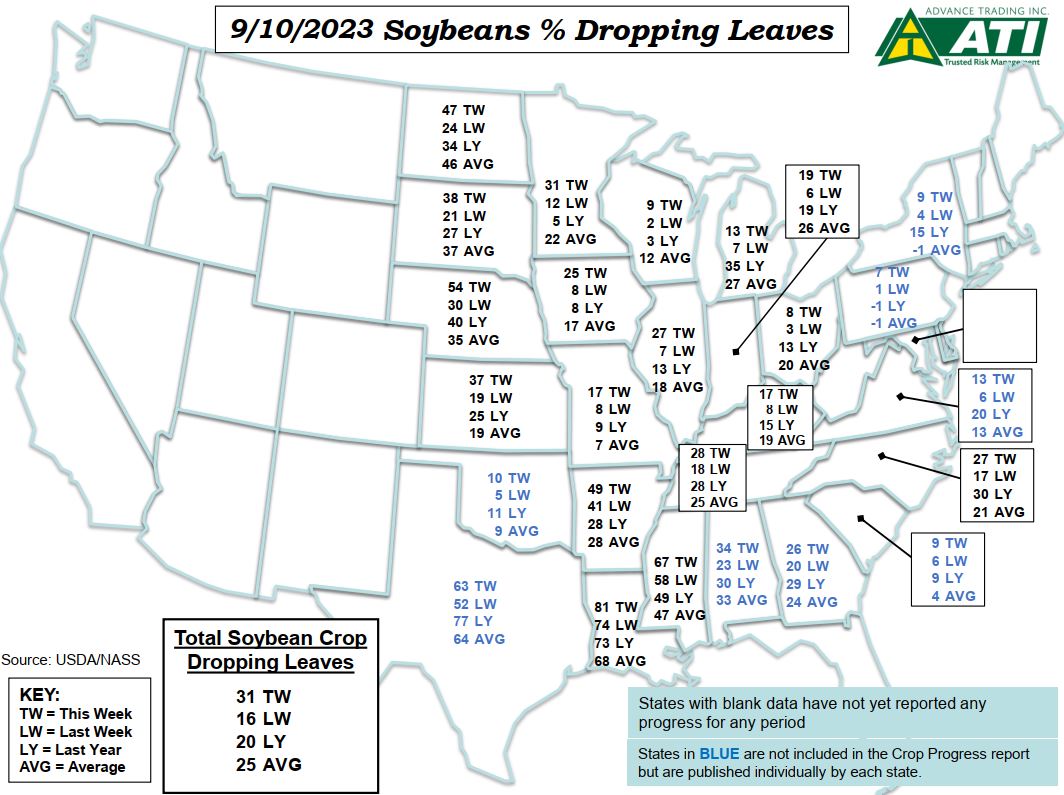
| Soybean Dropping Leaves | 31% TW vs. 16% LW, 20% LY, 25% AVG |
| Milo Headed | 97% TW vs. 93% LW, 95% LY, 99% AVG |
| Milo Coloring | 74% TW vs. 61% LW, 72% LY, 76% AVG |
| Milo Mature | 37% TW vs. 28% LW, 35% LY, 34% AVG |
| Milo Harvested | 21% TW vs. 19% LW, 23% LY, 22% AVG |
| Winter Wheat Planted | 7% TW vs. 1% LW, 9% LY, 7% AVG |
| Spring Wheat Harvested | 87% TW vs. 74% LW, 83% LY, 87% AVG |
| Source: USDA/NASS |
Read the complete NASS report here
Graphics courtesy of Advance Trading Inc.
September 3rd Crop Progress Report
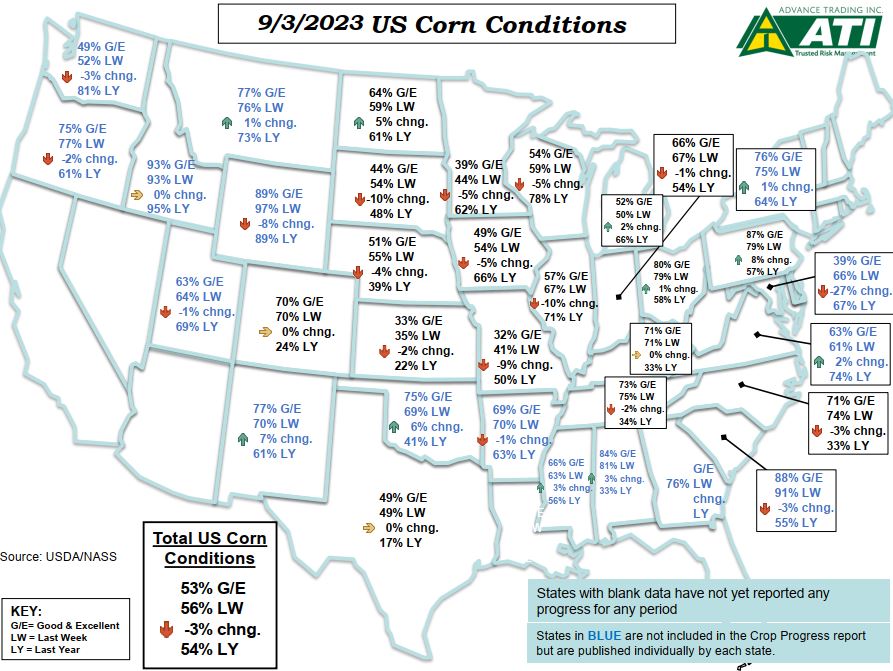

The hot and dry weather in recent weeks has taken its toll on crop condition scores as they have deteriorated. Corn conditions declined to 53% good-excellent vs. 56% last week and 54% last year. Soybean condition scores dropped to 53% good-excellent vs. 58% last week and 57% last year.
| Conditions (Good + Excellent) | |
| Corn Conditions | G/E: 53% TW vs. 56% LW, 54% LY |
| Soybean Conditions | G/E: 53% TW vs. 58% LW, 57% LY |
| Milo Conditions | G/E: 44% TW vs. 45% LW, 21% LY |
| Crop Progress Summary | |
| Corn Dough | 93% TW vs. 88% LW, 91% LY, 92% AVG |
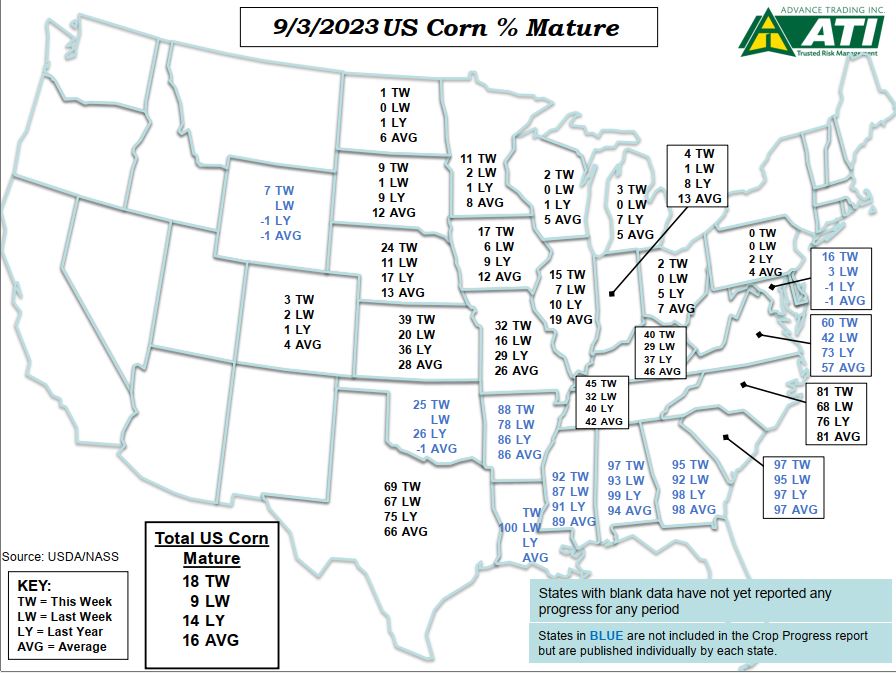
| Corn Dented | 67% TW vs. 51% LW, 61% LY, 65% AVG |
| Corn Mature | 18% TW vs. 9% LW, 14% LY, 16% AVG |
| Soybean Setting Pods | 95% TW vs. 91% LW, 94% LY, 94% AVG |
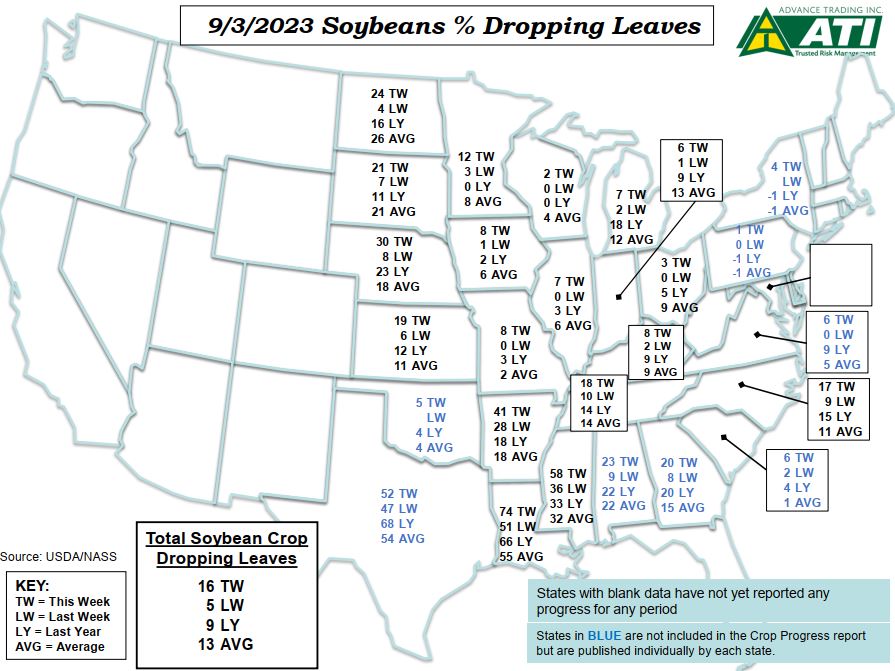
| Soybean Dropping Leaves | 16% TW vs. 5% LW, 9% LY, 13% AVG |
| Milo Headed | 93% TW vs. 89% LW, 91% LY, 96% AVG |
| Milo Coloring | 61% TW vs. 48% LW, 60% LY, 64% AVG |
| Milo Mature | 28% TW vs. 22% LW, 27% LY, 28% AVG |
| Milo Harvested | 19% TW vs. 17% LW, 20% LY, 21% AVG |
| Winter Wheat Planted | 1% TW vs. (NA)% LW, 3% LY, 3% AVG |
| Spring Wheat Harvested | 74% TW vs. 54% LW, 68% LY, 77% AVG |
| Source: USDA/NASS |
Read the complete NASS report here
Graphics courtesy of Advance Trading Inc
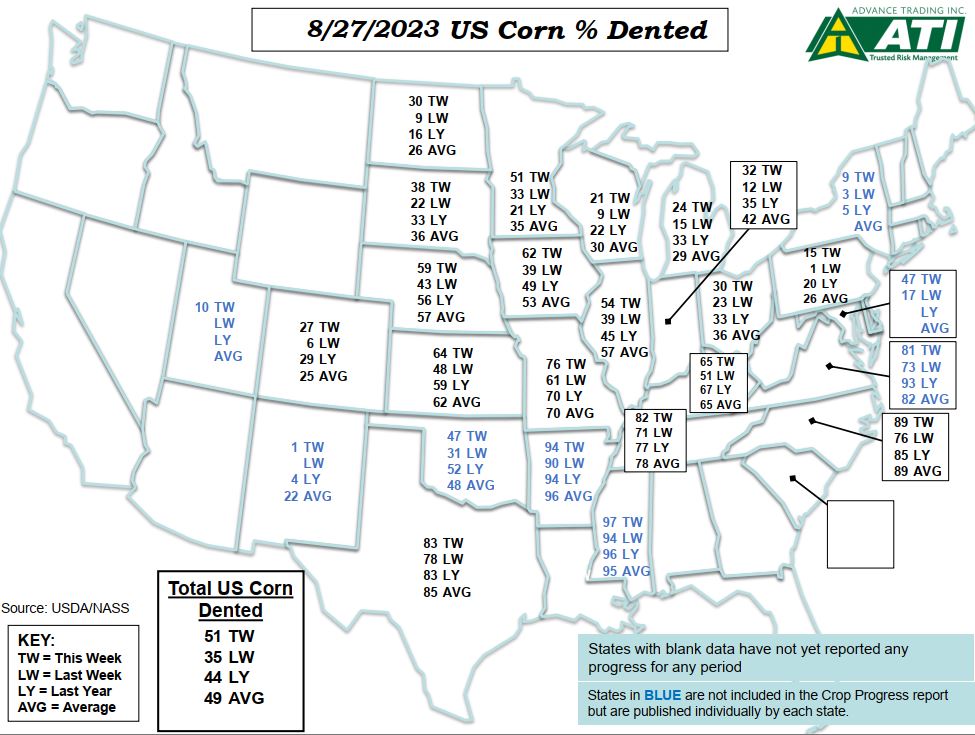
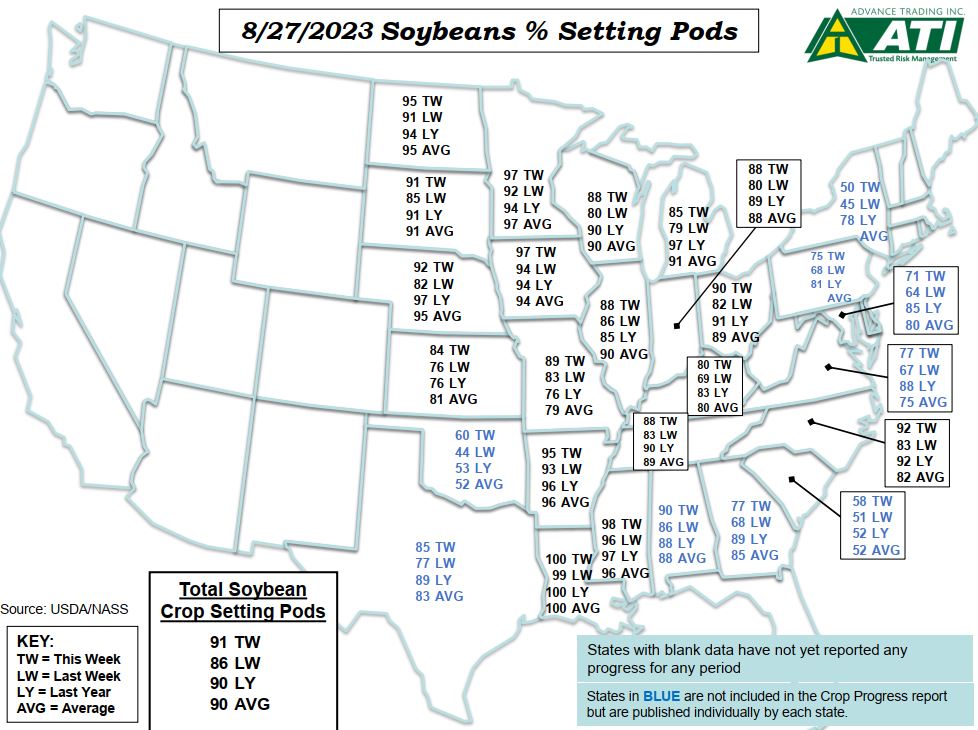
August 27th Crop Progress Report
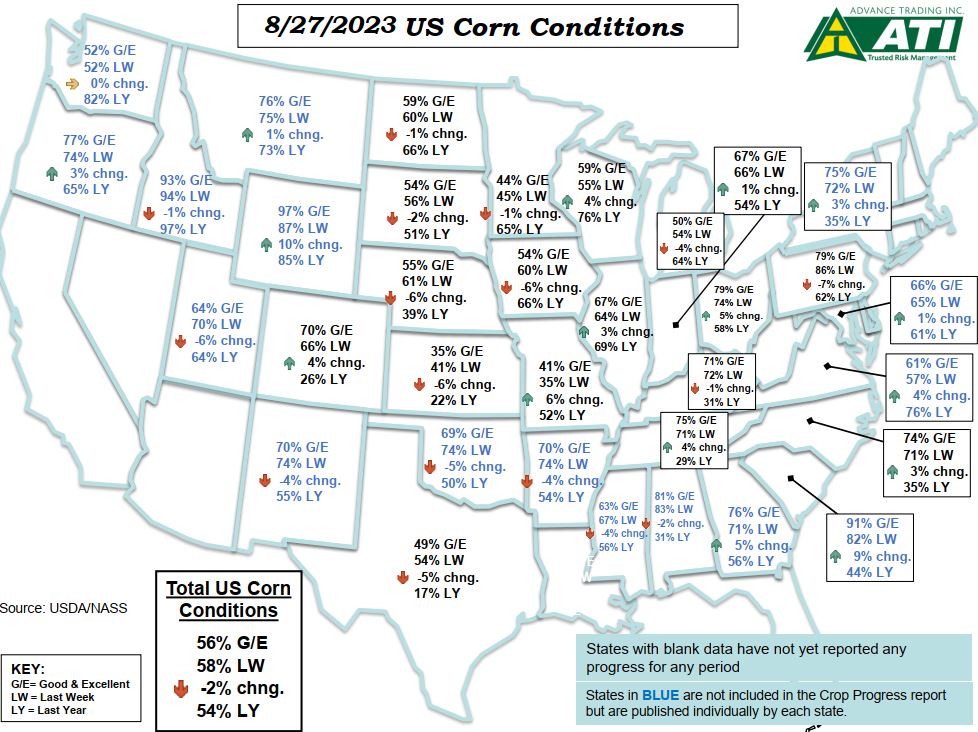

Hot and dry weather took its toll on crop condition scores as they backed down in the most recent crop progress report from NASS.
Corn conditions declined to 56% good-excellent vs. 58% last week and 54% last year. Soybean condition scores dipped to 58% good-excellent vs. 59% last week and 57% last year.
| Conditions (Good + Excellent) | |
| Corn Conditions | G/E: 56% TW vs. 58% LW, 54% LY |
| Soybean Conditions | G/E: 58% TW vs. 59% LW, 57% LY |
| Milo Conditions | G/E: 45% TW vs. 51% LW, 21% LY |
| Spring Wheat Conditions | G/E: 37% TW vs. 38% LW, 68% LY |
| Crop Progress Summary | |
| Corn Dough | 88% TW vs. 78% LW, 84% LY, 86% AVG |
| Corn Dented | 51% TW vs. 35% LW, 44% LY, 49% AVG |
| Corn Mature | 9% TW vs. 4% LW, 7% LY, 8% AVG |
| Soybean Setting Pods | 91% TW vs. 86% LW, 90% LY, 90% AVG |
| Soybean Dropping Leaves | 5% TW vs. (NA)% LW, 4% LY, 6% AVG |
| Milo Headed | 89% TW vs. 81% LW, 87% LY, 91% AVG |
| Milo Coloring | 48% TW vs. 38% LW, 46% LY, 51% AVG |
| Milo Mature | 22% TW vs. 18% LW, 23% LY, 23% AVG |
| Milo Harvested | 17% TW vs. (NA)% LW, 18% LY, 19% AVG |
| Spring Wheat Harvested | 54% TW vs. 39% LW, 48% LY, 63% AVG |
| Source: USDA/NASS |
Read the complete NASS report here
Graphics courtesy of Advance Trading Inc.
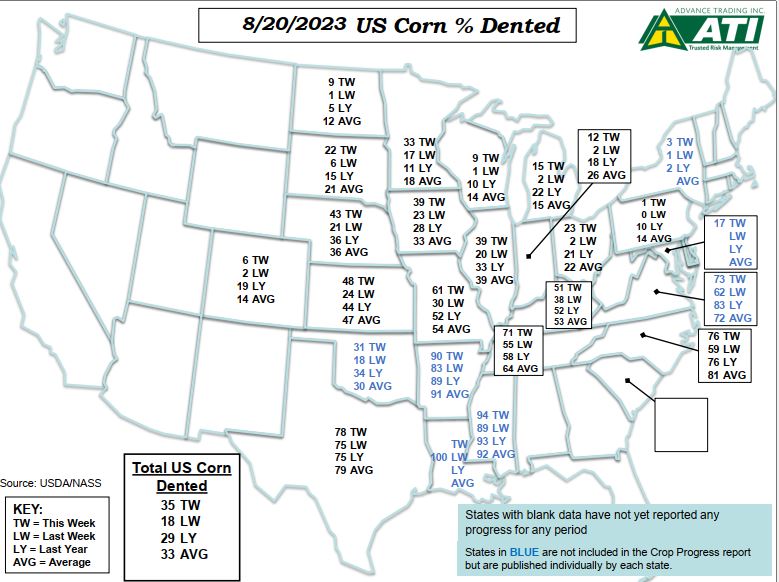
August 20th Crop Progress Report
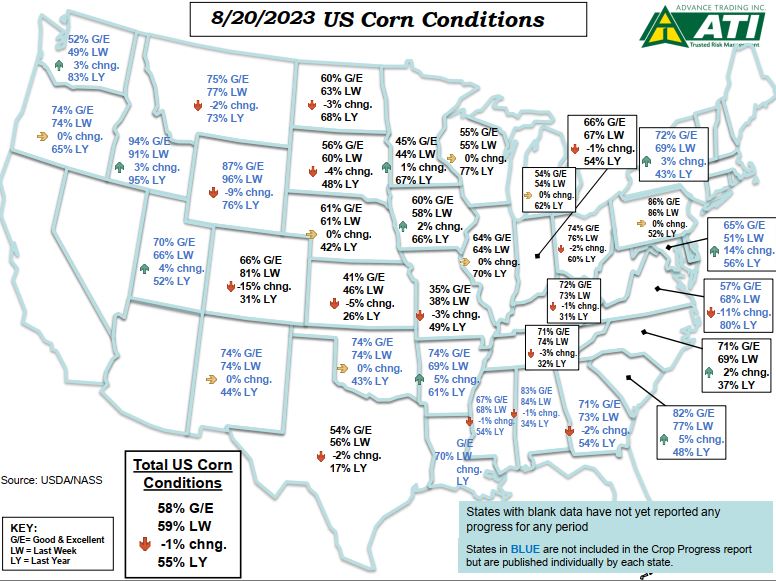


For the first time in a few weeks, corn conditions scores declined. This week’s ratings are 58% good-excellent vs. 59% last week and 55% last year. Soybean conditions were steady this week at 59% good-excellent vs. 57% last year.
| Conditions (Good + Excellent) | |
| Corn Conditions | G/E: 58% TW vs. 59% LW, 55% LY |
| Soybean Conditions | G/E: 59% TW vs. 59% LW, 57% LY |
| Milo Conditions | G/E: 51% TW vs. 54% LW, 25% LY |
| Spring Wheat Conditions | G/E: 38% TW vs. 42% LW, 64% LY |
| Crop Progress Summary | |
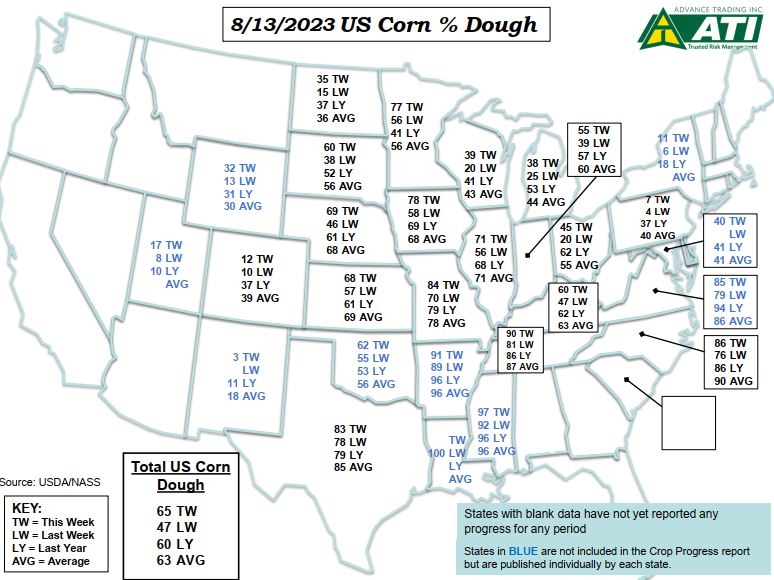
| Corn Dough | 78% TW vs. 65% LW, 73% LY, 77% AVG |
| Corn Dented | 35% TW vs. 18% LW, 29% LY, 33% AVG |
| Corn Mature | 4% TW vs. (NA)% LW, 4% LY, 4% AVG |
| Soybean Blooming | 96% TW vs. 94% LW, 96% LY, 96% AVG |
| Soybean Setting Pods | 86% TW vs. 78% LW, 83% LY, 84% AVG |
| Milo Headed | 81% TW vs. 71% LW, 77% LY, 84% AVG |
| Milo Coloring | 38% TW vs. 30% LW, 36% LY, 40% AVG |
| Milo Mature | 18% TW vs. (NA)% LW, 20% LY, 21% AVG |
| Winter Wheat Harvested | 96% TW vs. 92% LW, 94% LY, 96% AVG |
| Spring Wheat Harvested | 39% TW vs. 24% LW, 31% LY, 46% AVG |
| Source: USDA/NASS |
Read the complete NASS report here
Graphics courtesy of Advance Trading Inc.
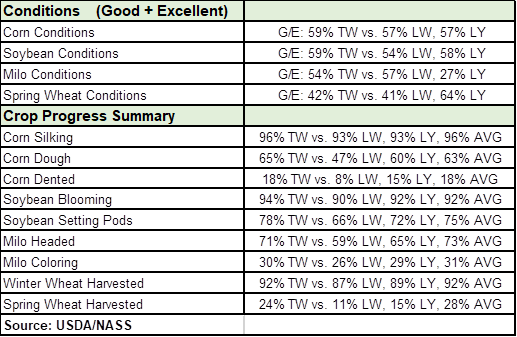
August 13th Crop Progress Report
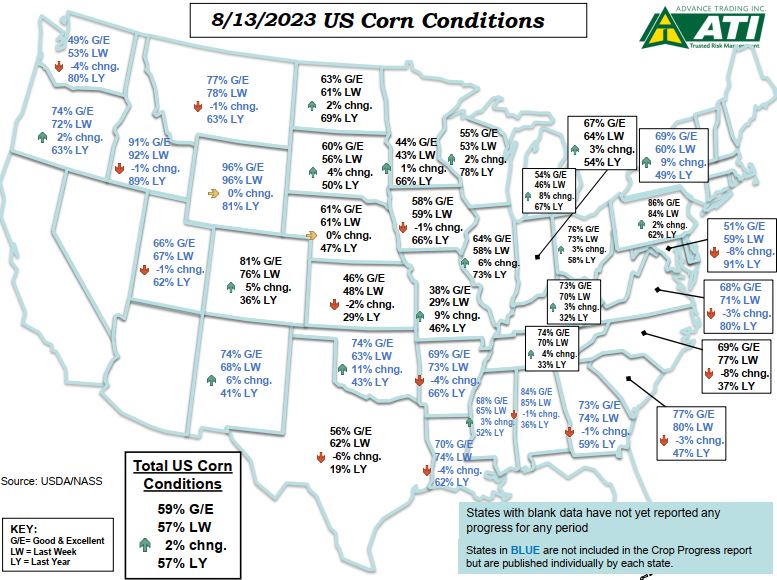


Improving weather conditions have translated into improving crop condition scores once again this week. Corn conditions improved to 59% good-excellent vs. 57% last week and 57% last year. Soybean condition scores jumped up to 59% good-excellent vs. 54% last week and 58% last year.
Read the complete NASS report here
Graphics courtesy of Advance Trading Inc.
August 6th Crop Progress Report


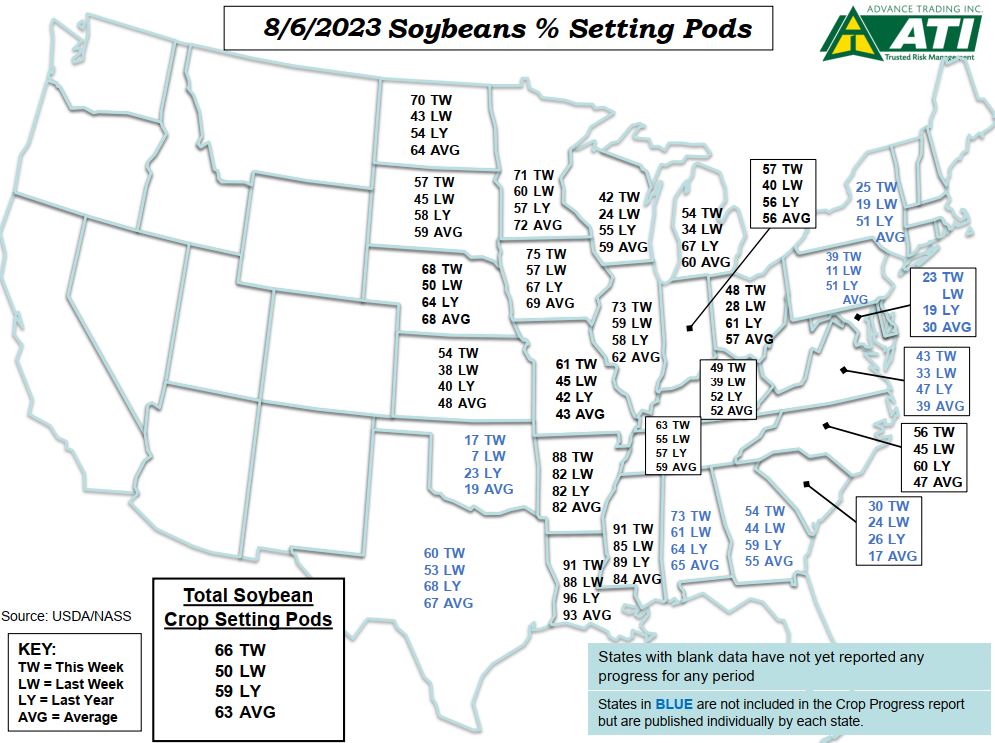
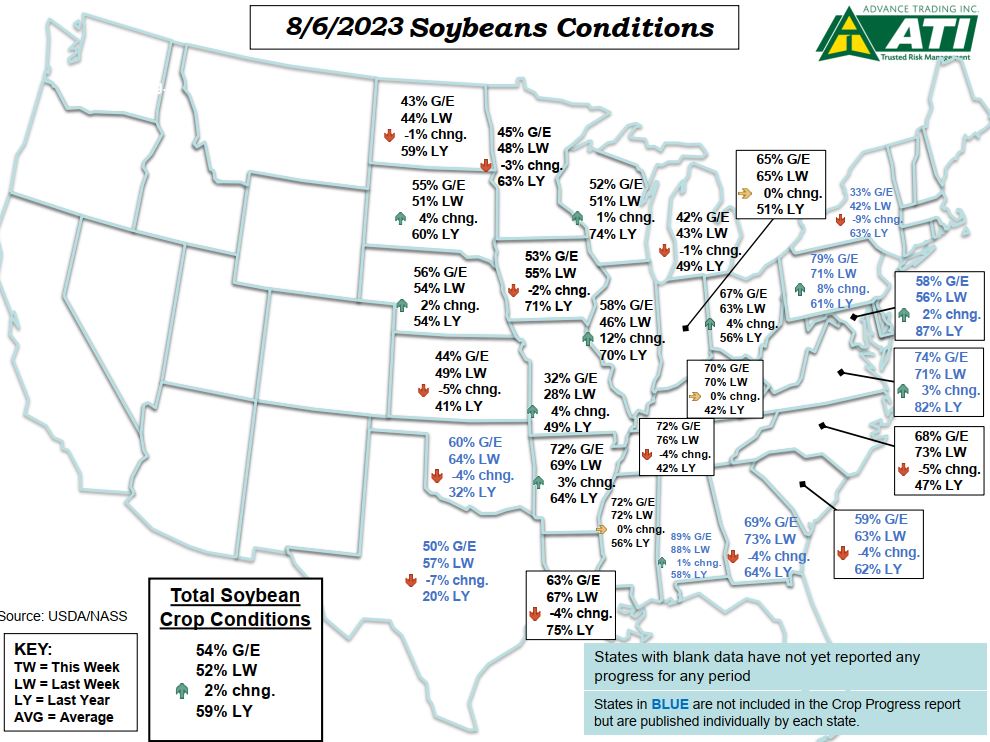
Recent rains have helped improve crop condition scores with both corn and soybean scores improving by 2% good-excellent this past week.
| Conditions (Good + Excellent) | |
| Corn Conditions | G/E: 57% TW vs. 55% LW, 58% LY |
| Soybean Conditions | G/E: 54% TW vs. 52% LW, 59% LY |
| Milo Conditions | G/E: 57% TW vs. 55% LW, 29% LY |
| Spring Wheat Conditions | G/E: 41% TW vs. 42% LW, 64% LY |
| Crop Progress Summary | |
| Corn Silking | 93% TW vs. 84% LW, 89% LY, 91% AVG |
| Corn Dough | 47% TW vs. 29% LW, 42% LY, 46% AVG |
| Corn Dented | 8% TW vs. (NA)% LW, 6% LY, 8% AVG |
| Soybean Blooming | 90% TW vs. 83% LW, 88% LY, 87% AVG |
| Soybean Setting Pods | 66% TW vs. 50% LW, 59% LY, 63% AVG |
| Milo Headed | 59% TW vs. 45% LW, 53% LY, 60% AVG |
| Milo Coloring | 26% TW vs. 23% LW, 24% LY, 26% AVG |
| Winter Wheat Harvested | 87% TW vs. 80% LW, 85% LY, 88% AVG |
| Spring Wheat Harvested | 11% TW vs. 2% LW, 8% LY, 14% AVG |
| Source: USDA/NASS |
Read the complete NASS report here
Graphics courtesy of Advance Trading Inc
July 30th Crop Progress Report
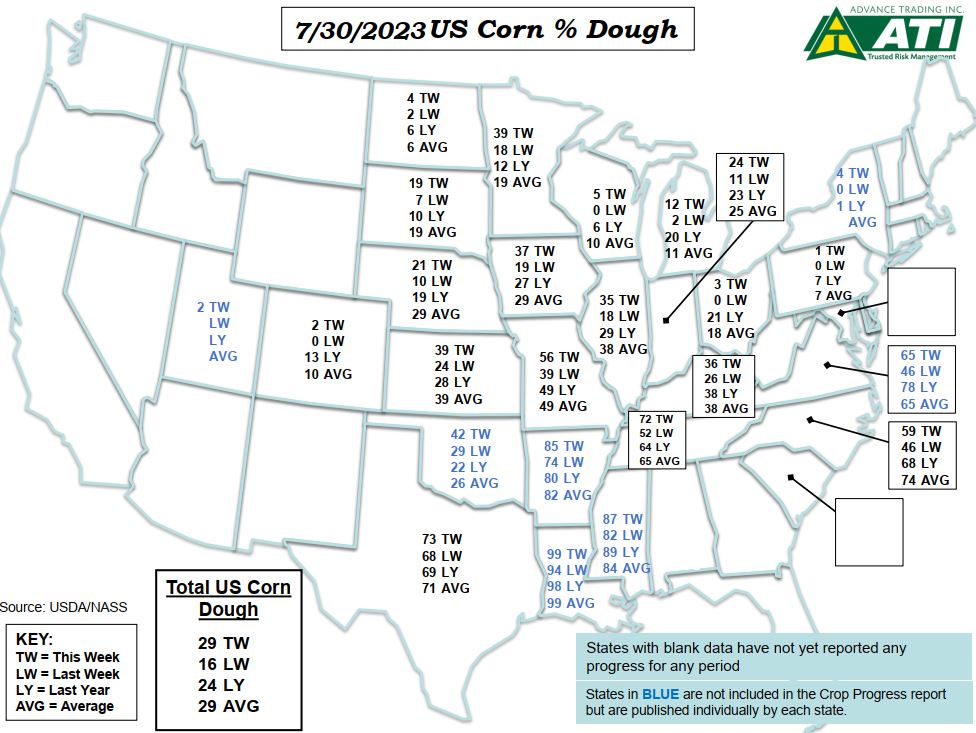
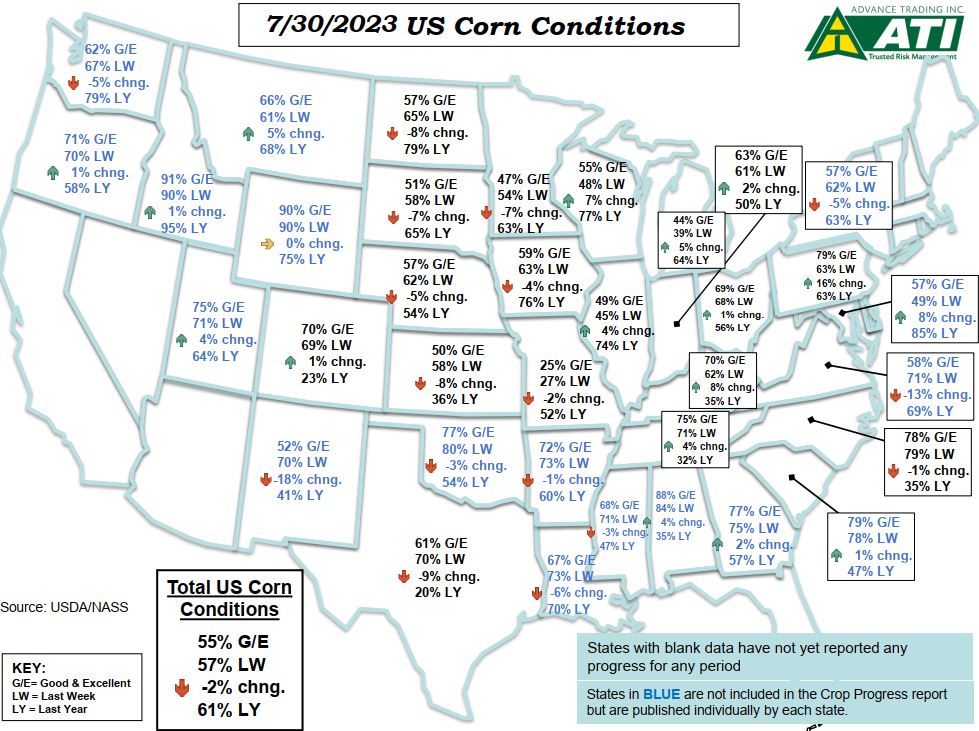
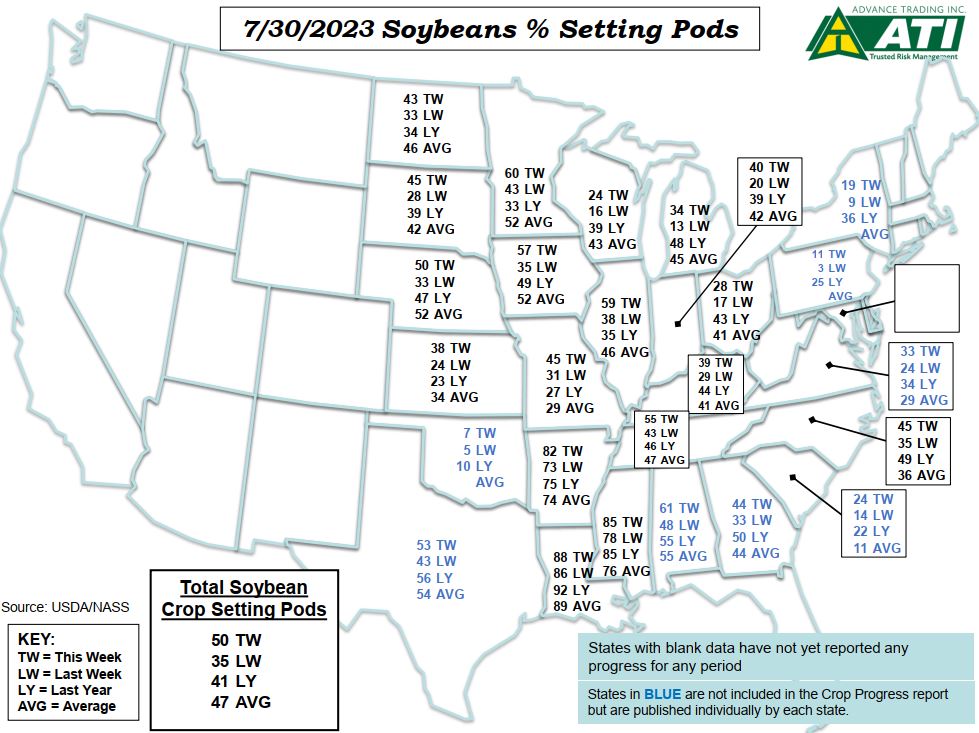
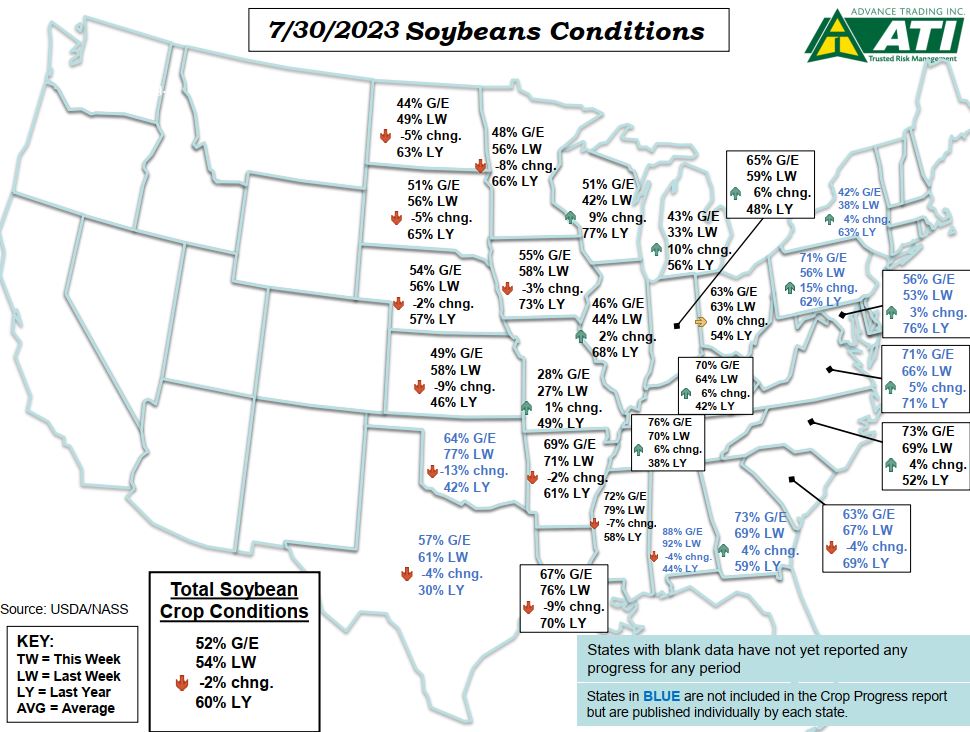
The hot temperatures across the country showed up in this week’s crop conditions scores as ratings declined for both corn and soybean crops.
Corn conditions declined to 55% good-excellent vs. 57% last week and 61% last year. Soybean conditions dipped to 52% good-excellent 54% last week and 60% last year.
| Conditions (Good + Excellent) | |
| Corn Conditions | G/E: 55% TW vs. 57% LW, 61% LY |
| Soybean Conditions | G/E: 52% TW vs. 54% LW, 60% LY |
| Milo Conditions | G/E: 55% TW vs. 60% LW, 28% LY |
| Spring Wheat Conditions | G/E: 42% TW vs. 49% LW, 70% LY |
| Crop Progress Summary | |
| Corn Silking | 84% TW vs. 68% LW, 77% LY, 82% AVG |
| Corn Dough | 29% TW vs. 16% LW, 24% LY, 29% AVG |
| Soybean Blooming | 83% TW vs. 70% LW, 77% LY, 78% AVG |
| Soybean Setting Pods | 50% TW vs. 35% LW, 41% LY, 47% AVG |
| Milo Headed | 45% TW vs. 36% LW, 42% LY, 47% AVG |
| Milo Coloring | 23% TW vs. 21% LW, 21% LY, 22% AVG |
| Winter Wheat Harvested | 80% TW vs. 68% LW, 81% LY, 83% AVG |
| Spring Wheat Headed | 97% TW vs. 94% LW, 95% LY, 98% AVG |
| Spring Wheat Harvested | 2% TW vs. (NA)% LW, 3% LY, 5% AVG |
| Source: USDA/NASS |
Read the complete NASS report here
Graphics courtesy of Advance Trading, Inc.
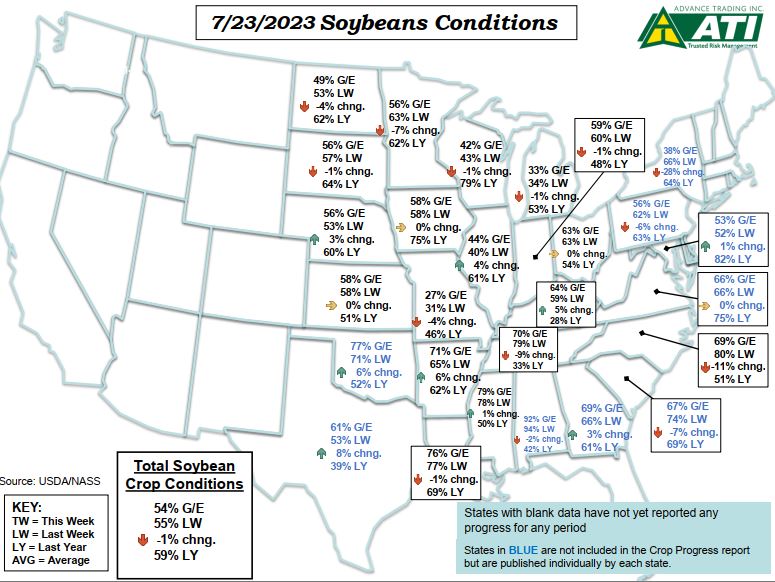
July 23rd Crop Progress Report
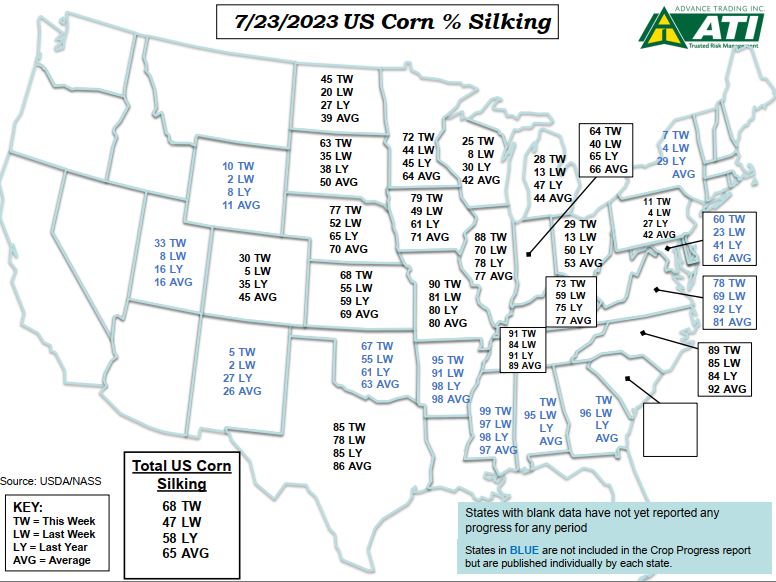
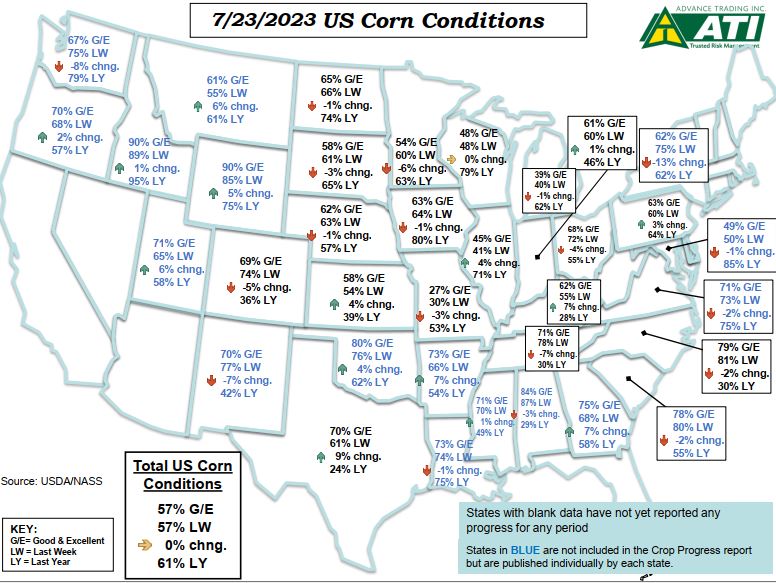
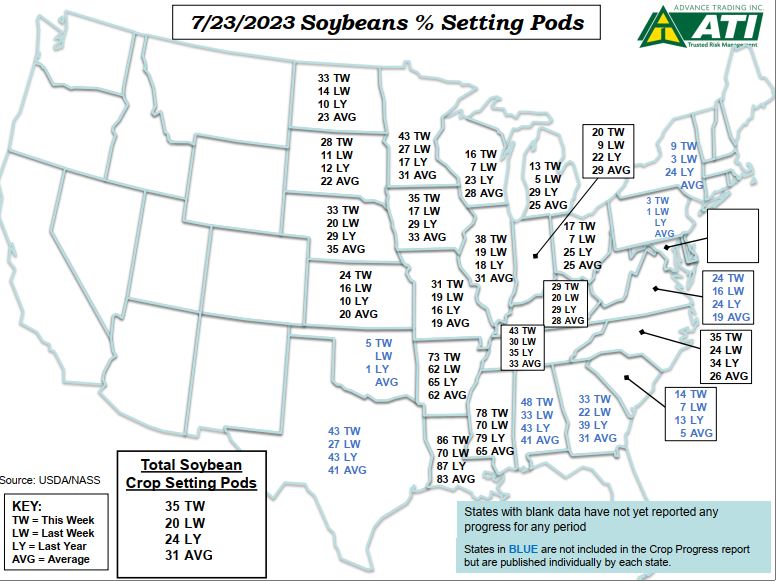
While corn and soybean crop progress remains ahead of last year and the 5-year average pace, condition scores are also behind last year and average.
Corn condition scores were steady this week nationally at 57% good-excellent vs 57% last week and 61% last year. Soybean condition scores declined to 54% good-excellent vs. 55% last week and 59% last year.
| Conditions (Good + Excellent) | |
| Corn Conditions | G/E: 57% TW vs. 57% LW, 61% LY |
| Soybean Conditions | G/E: 54% TW vs. 55% LW, 59% LY |
| Milo Conditions | G/E: 60% TW vs. 58% LW, 30% LY |
| Spring Wheat Conditions | G/E: 49% TW vs. 51% LW, 68% LY |
| Crop Progress Summary | |
| Corn Silking | 68% TW vs. 47% LW, 58% LY, 65% AVG |
| Corn Dough | 16% TW vs. 7% LW, 12% LY, 14% AVG |
| Soybean Blooming | 70% TW vs. 56% LW, 62% LY, 66% AVG |
| Soybean Setting Pods | 35% TW vs. 20% LW, 24% LY, 31% AVG |
| Milo Headed | 36% TW vs. 29% LW, 34% LY, 37% AVG |
| Milo Coloring | 21% TW vs. 17% LW, 19% LY, 19% AVG |
| Winter Wheat Harvested | 68% TW vs. 56% LW, 76% LY, 77% AVG |
| Spring Wheat Headed | 94% TW vs. 86% LW, 83% LY, 93% AVG |
| Source: USDA/NASS |
Read the complete NASS report here
Graphics courtesy of Advance Trading, Inc.
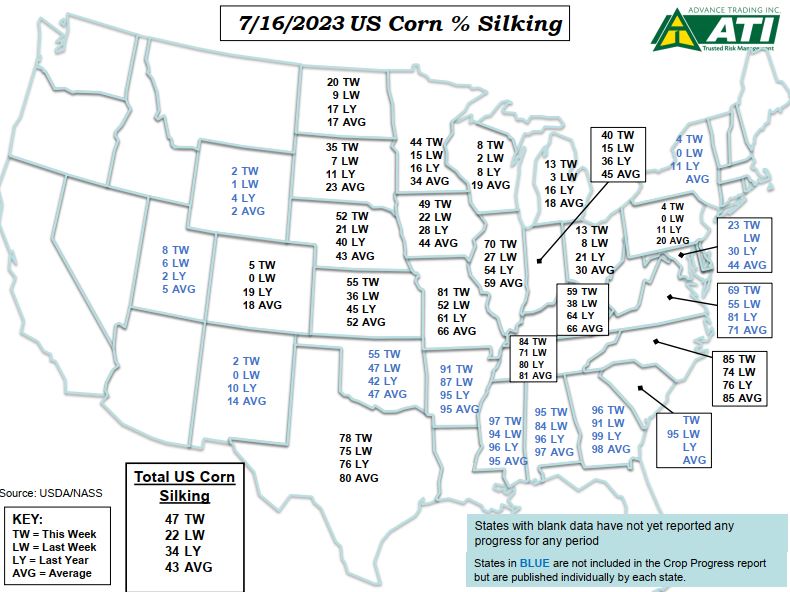
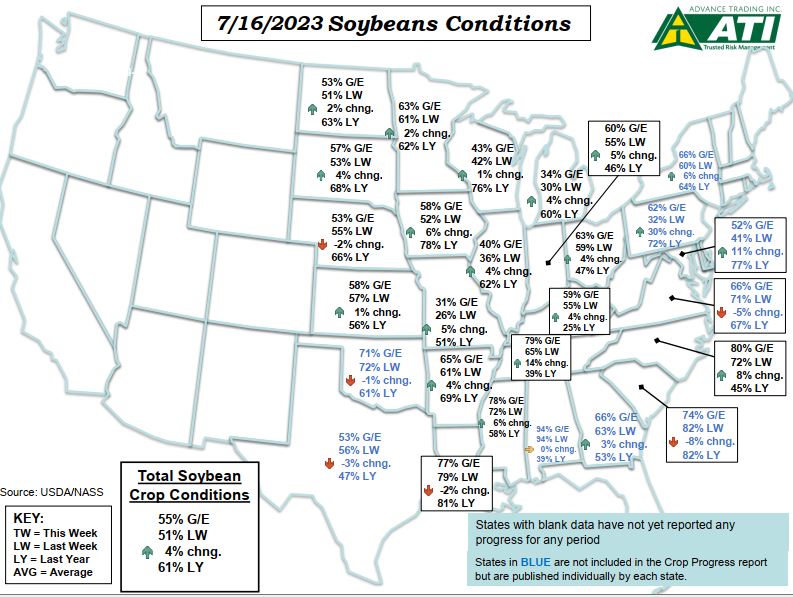
July 16th Crop Progress Report
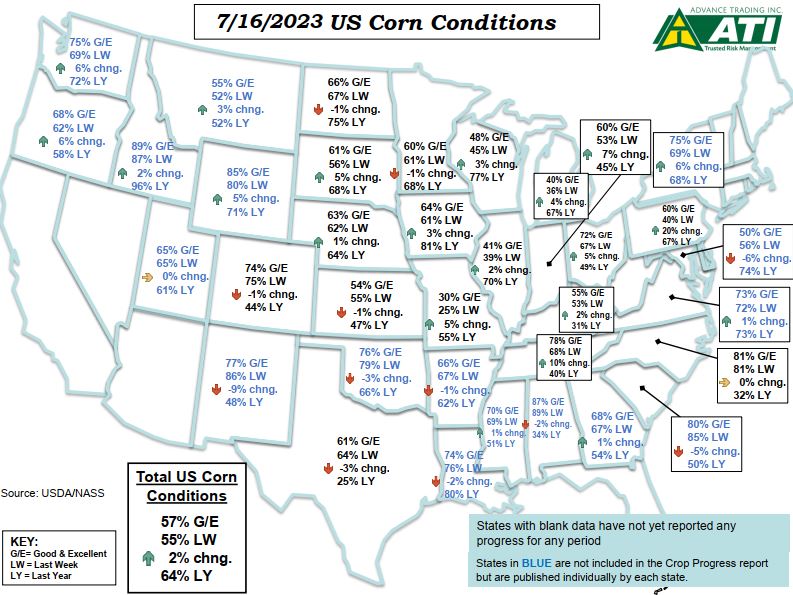
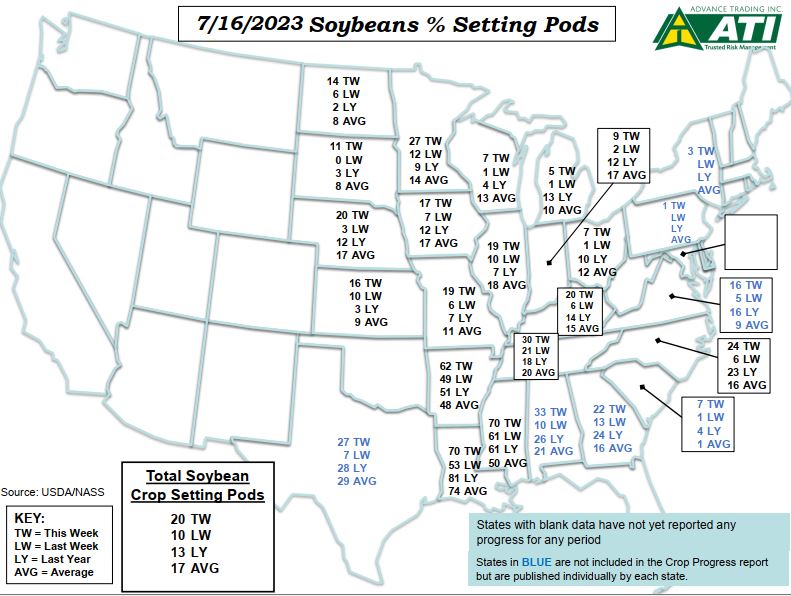
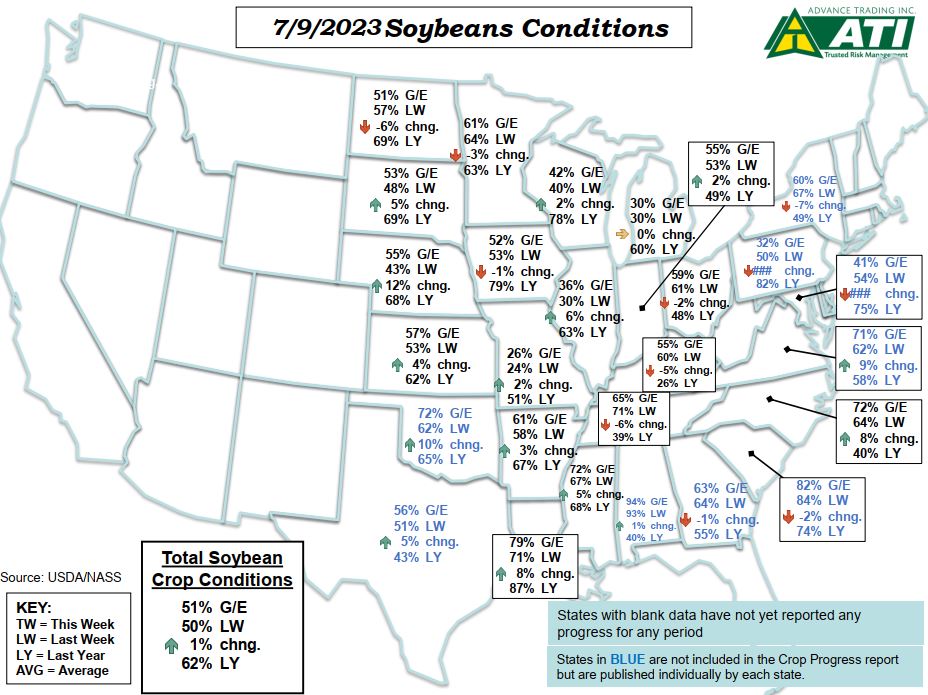
Despite ongoing drought concerns, enough rain events has spread across the country to alleviate some dryness and allow crop condition scores to improve again in this week’s Crop Progress and Condition Report.
Corn conditions improved to 57% good-excellent vs. 55% last week and 64% last year. Soybean conditions improved to 55% good-excellent vs. 51% last week and 61% last year.
| Conditions (Good + Excellent) | |
| Corn Conditions | G/E: 57% TW vs. 55% LW, 64% LY |
| Soybean Conditions | G/E: 55% TW vs. 51% LW, 61% LY |
| Milo Conditions | G/E: 58% TW vs. 55% LW, 35% LY |
| Spring Wheat Conditions | G/E: 51% TW vs. 47% LW, 71% LY |
| Crop Progress Summary | |
| Corn Silking | 47% TW vs. 22% LW, 34% LY, 43% AVG |
| Corn Dough | 7% TW vs. 3% LW, 5% LY, 6% AVG |
| Soybean Blooming | 56% TW vs. 39% LW, 46% LY, 51% AVG |
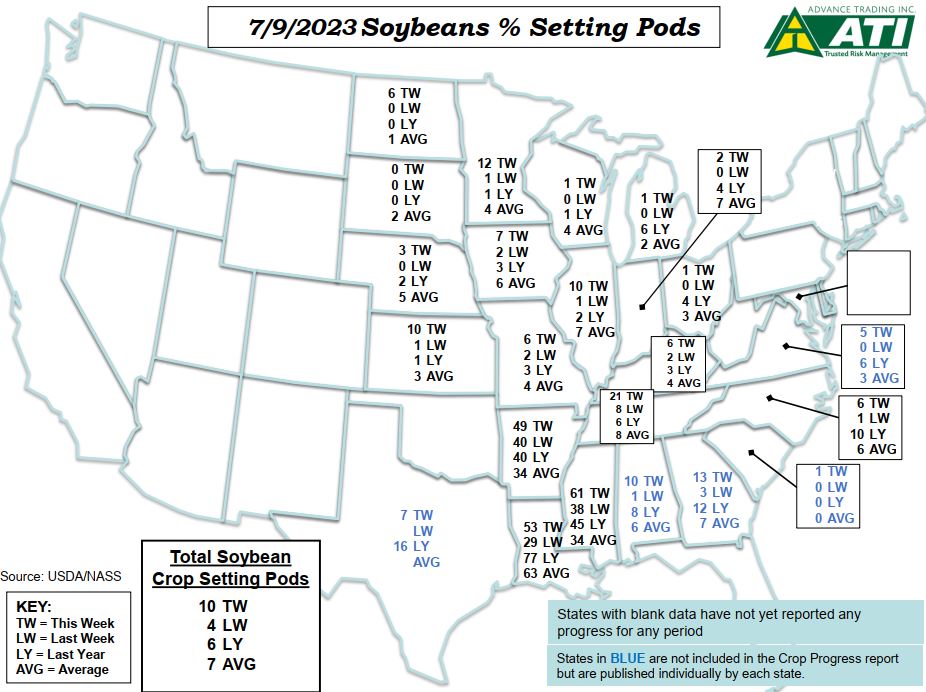
| Soybean Setting Pods | 20% TW vs. 10% LW, 13% LY, 17% AVG |
| Milo Headed | 29% TW vs. 25% LW, 28% LY, 30% AVG |
| Milo Coloring | 17% TW vs. 15% LW, 17% LY, 17% AVG |
| Winter Wheat Harvested | 56% TW vs. 46% LW, 69% LY, 69% AVG |
| Spring Wheat Headed | 86% TW vs. 72% LW, 65% LY, 83% AVG |
| Source: USDA/NASS |
Read the complete NASS report here
Graphics courtesy of Advance Trading, Inc.
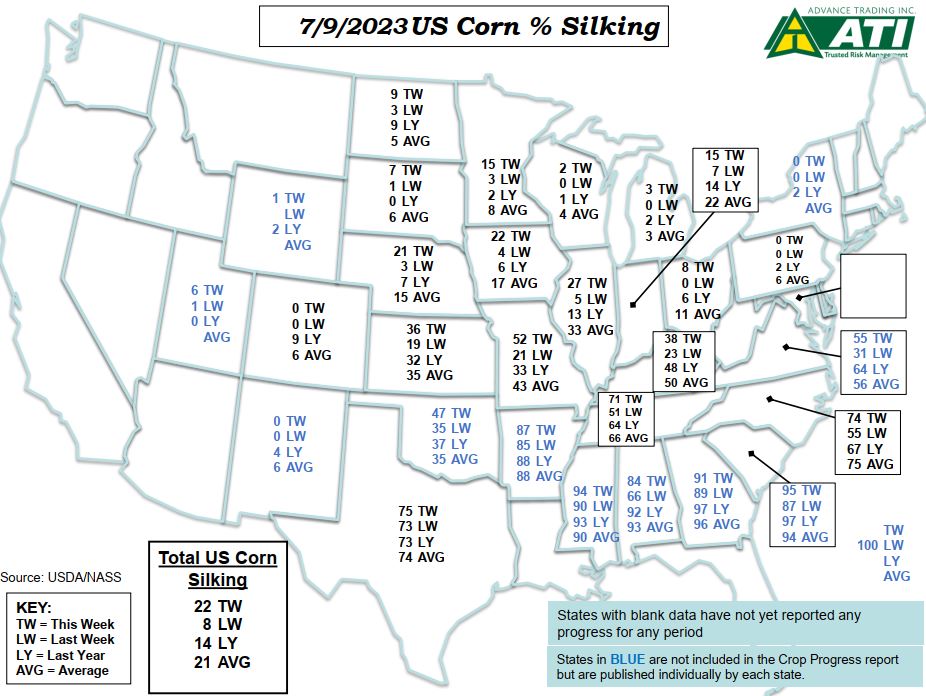
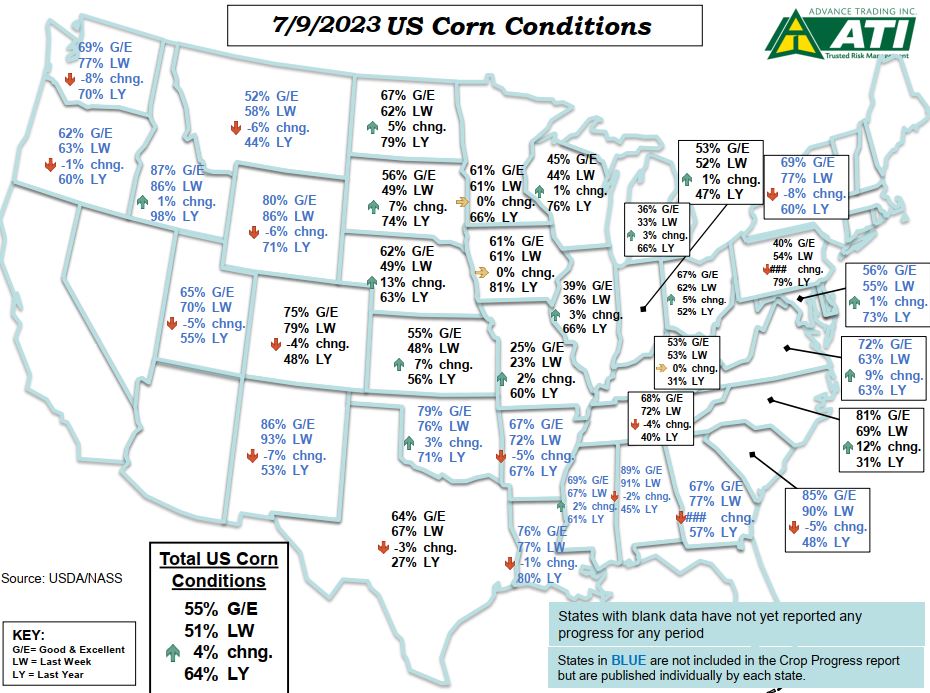
Corn crop conditions showed some improvement again this week. National corn condition scores improved to 55% good-excellent vs. 51% last week and 64% last year. Soybean conditions also slightly improved to 51% good-excellent vs. 50% last week and 62% last year.
Read the complete NASS report here
Graphics courtesy of Advance Trading, Inc.
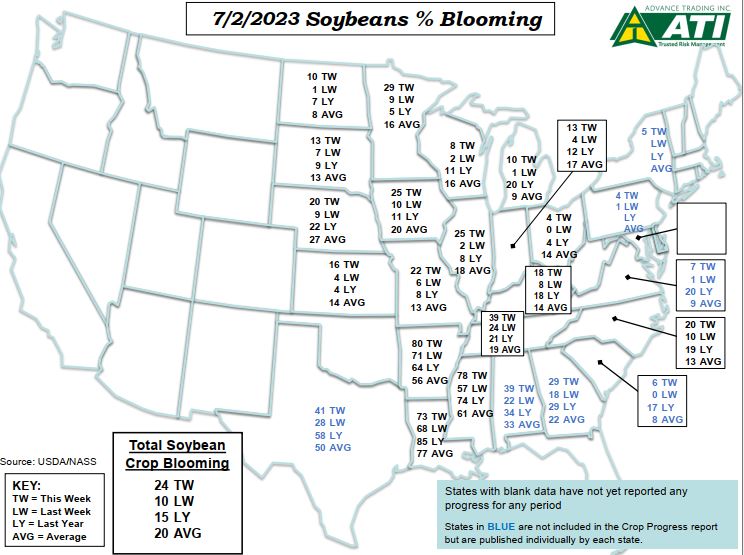
July 2nd Crop Progress Report
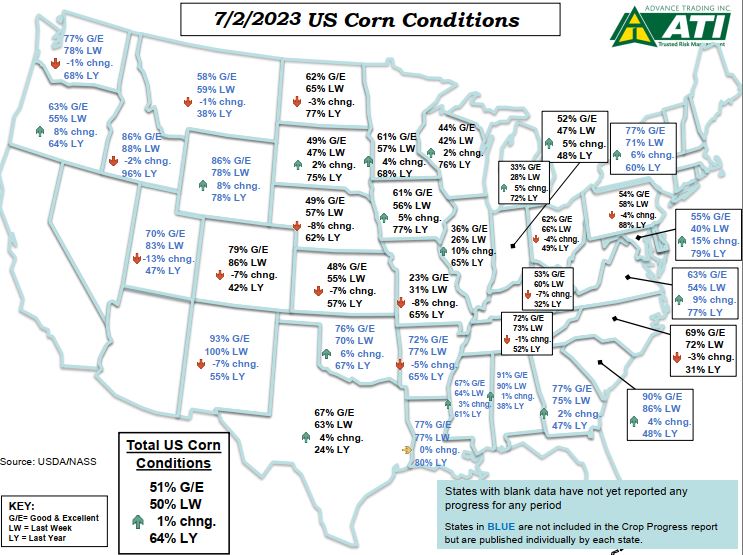

Crop conditions stabilized in this week’s report and even improved in some areas. Illinois is the state we have been watching most closely as previous deterioration has been dramatic. Recent rains have improved the mood there in this report. This week Illinois’ good-excellent corn ratings improved by 10% and the soybean ratings improved by 5%.
Nationally, corn scores improved to 51% good-excellent vs. 50% last week and 64% last year. However, soybean conditions did decline to 50% good-excellent vs. 51% last week and 63% last year.
| Conditions (Good + Excellent) | |
| Corn Conditions | G/E: 51% TW vs. 50% LW, 64% LY |
| Soybean Conditions | G/E: 50% TW vs. 51% LW, 63% LY |
| Milo Conditions | G/E: 55% TW vs. 57% LW, 42% LY |
| Winter Wheat Conditions | G/E: 40% TW vs. 40% LW, 31% LY |
| Spring Wheat Conditions | G/E: 48% TW vs. 50% LW, 66% LY |
| Crop Progress Summary | |
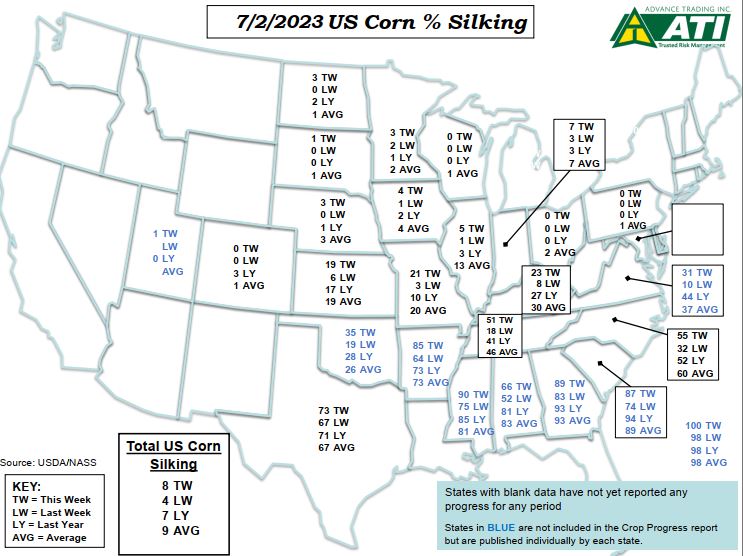
| Corn Silking | 8% TW vs. 4% LW, 7% LY, 9% AVG |
| Soybean Blooming | 24% TW vs. 10% LW, 15% LY, 20% AVG |
| Soybean Setting Pods | 4% TW vs. (NA)% LW, 3% LY, 2% AVG |
| Milo Planted | 92% TW vs. 85% LW, 96% LY, 97% AVG |
| Milo Headed | 21% TW vs. 16% LW, 21% LY, 22% AVG |
| Milo Coloring | 12% TW vs. (NA)% LW, 13% LY, 13% AVG |
| Winter Wheat Harvested | 37% TW vs. 24% LW, 52% LY, 46% AVG |
| Spring Wheat Headed | 51% TW vs. 31% LW, 18% LY, 46% AVG |
| Source: USDA/NASS |
Read the complete NASS report here
Graphics courtesy of Advance Trading, Inc.
June 25th Crop Progress Report
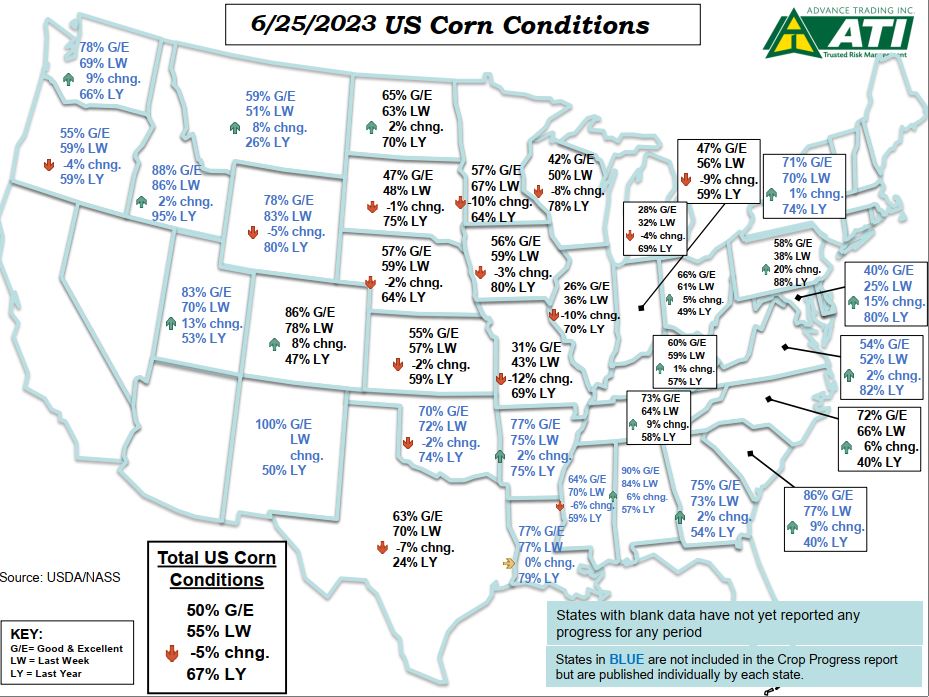
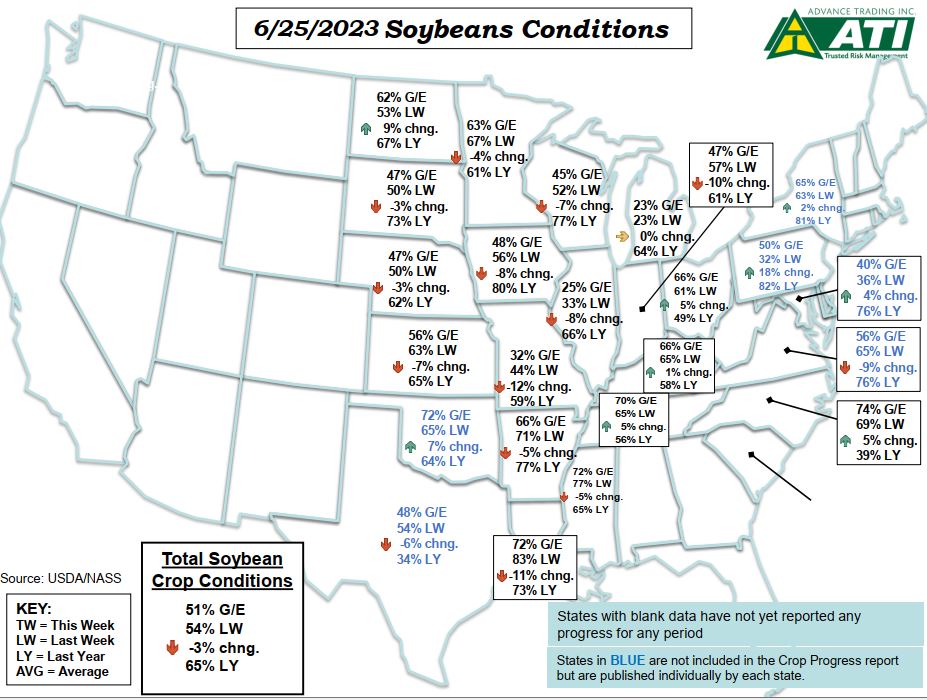
National corn and soybean crop condition scores suffered another large setback this week in the face of drought conditions in much of the country. Corn conditions fell to 50% good-excellent vs. 55% last week and 67% last year. Soybean conditions dropped to 51% good-excellent vs. 54% last week and 65% last year. Illinois looks in very poor shape with only 26% of the corn crop and 25% of the soybean crop rated good-excellent.
| Conditions (Good + Excellent) | |
| Corn Conditions | G/E: 50% TW vs. 55% LW, 67% LY |
| Soybean Conditions | G/E: 51% TW vs. 54% LW, 65% LY |
| Milo Conditions | G/E: 57% TW vs. 60% LW, 43% LY |
| Winter Wheat Conditions | G/E: 40% TW vs. 38% LW, 30% LY |
| Spring Wheat Conditions | G/E: 50% TW vs. 51% LW, 59% LY |
| Crop Progress Summary | |
| Corn Silking | 4% TW vs. (NA)% LW, 4% LY, 4% AVG |
| Soybean Emerged | 96% TW vs. 92% LW, 90% LY, 89% AVG |
| Soybean Blooming | 10% TW vs. (NA)% LW, 6% LY, 9% AVG |
| Milo Planted | 85% TW vs. 73% LW, 89% LY, 92% AVG |
| Milo Headed | 16% TW vs. 15% LW, 18% LY, 19% AVG |
| Winter Wheat Headed | 97% TW vs. 94% LW, 94% LY, 97% AVG |
| Winter Wheat Harvested | 24% TW vs. 15% LW, 39% LY, 33% AVG |
| Spring Wheat Emerged | 98% TW vs. 90% LW, 87% LY, 95% AVG |
| Spring Wheat Headed | 31% TW vs. 10% LW, 7% LY, 25% AVG |
| Source: USDA/NASS |
Read the complete NASS report here
Graphics courtesy of Advance Trading, Inc.
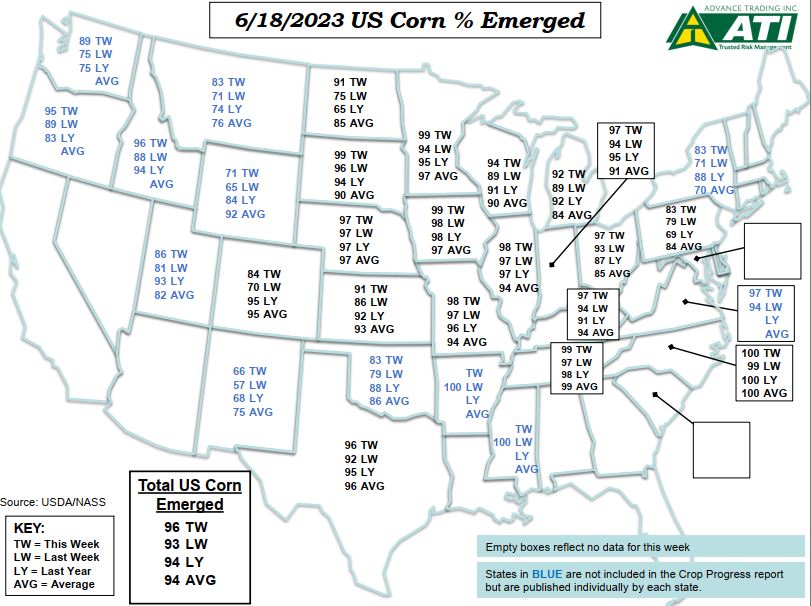
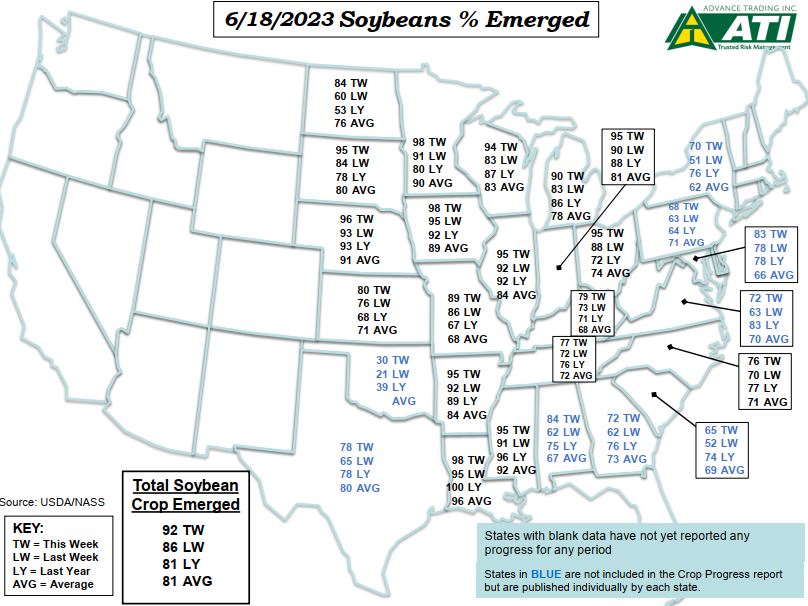
June 18th Crop Progress Report
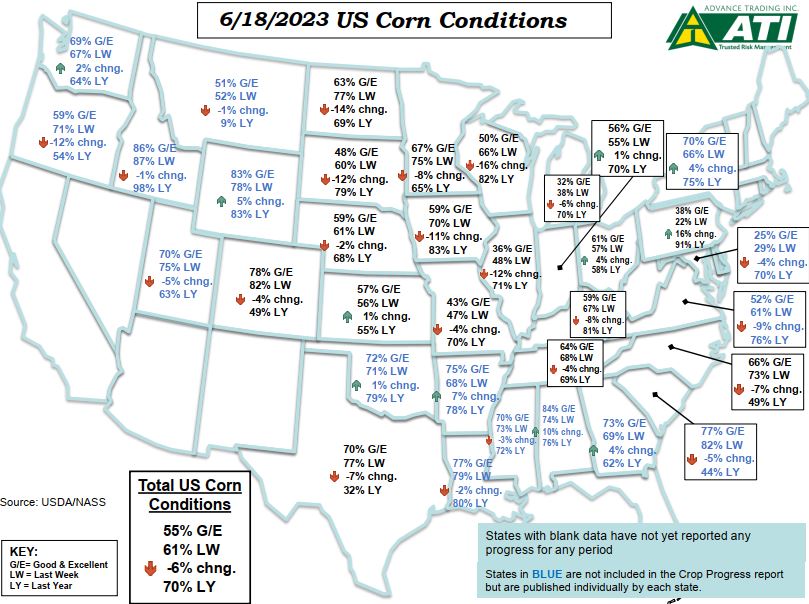

Another week of deteriorating crop condition scores as drought takes its toll on the corn and soybean crops. It wasn’t unusual to see double digit percentage drops in some states in this report. Corn condition scores dropped to 55% good-excellent vs. 61% last week and 70% last year. Soybean conditions slid to 54% good-excellent vs. 59% last week 68% last year. Illinois really stands out as suffering from the drought as their corn is only rated 36% good-excellent and their soybeans are 33% good-excellent.
| Conditions (Good + Excellent) | |
| Corn Conditions | G/E: 55% TW vs. 61% LW, 70% LY |
| Soybean Conditions | G/E: 54% TW vs. 59% LW, 68% LY |
| Milo Conditions | G/E: 60% TW vs. 57% LW, 46% LY |
| Winter Wheat Conditions | G/E: 38% TW vs. 38% LW, 30% LY |
| Spring Wheat Conditions | G/E: 51% TW vs. 60% LW, 59% LY |
| Crop Progress Summary | |
| Corn Emerged | 96% TW vs. 93% LW, 94% LY, 94% AVG |
| Soybean Emerged | 92% TW vs. 86% LW, 81% LY, 81% AVG |
| Milo Planted | 73% TW vs. 64% LW, 78% LY, 82% AVG |
| Milo Headed | 15% TW vs. (NA)% LW, 15% LY, 16% AVG |
| Winter Wheat Headed | 94% TW vs. 89% LW, 90% LY, 93% AVG |
| Winter Wheat Harvested | 15% TW vs. 8% LW, 23% LY, 20% AVG |
| Spring Wheat Emerged | 98% TW vs. 90% LW, 87% LY, 95% AVG |
| Spring Wheat Headed | 10% TW vs. (NA)% LW, 2% LY, 10% AVG |
| Source: USDA/NASS |
Read the complete NASS report here
Graphics courtesy of Advance Trading, Inc.
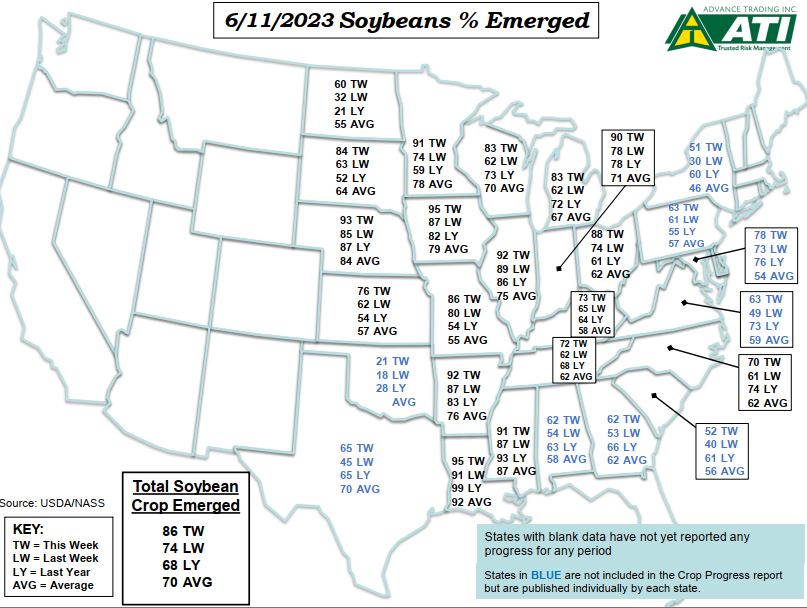
June 11th Crop Progress Report
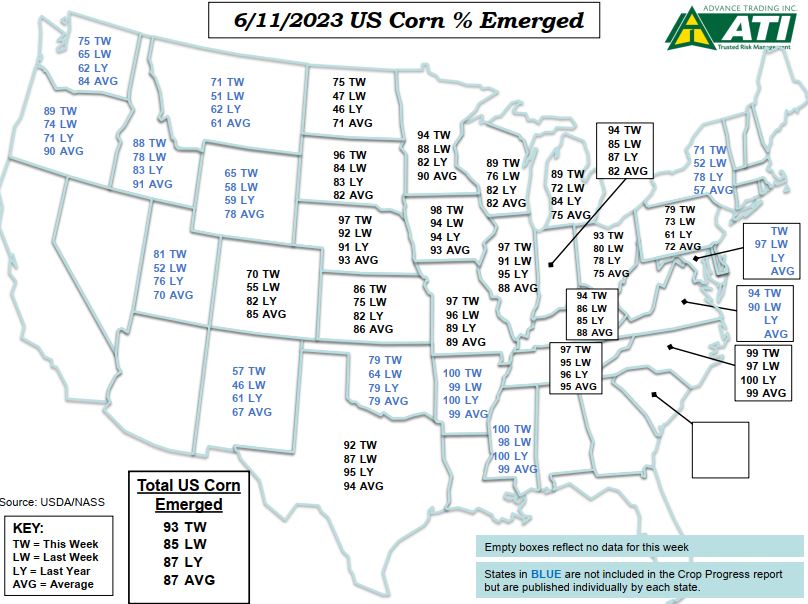
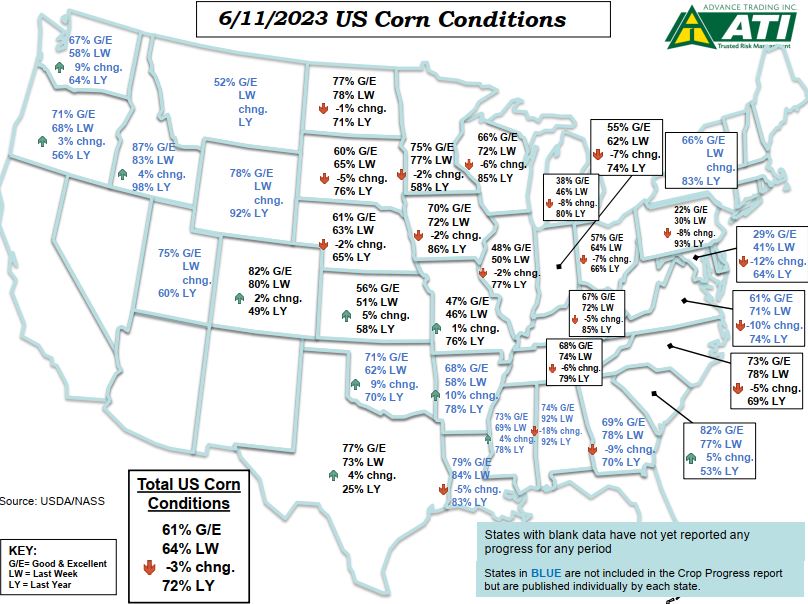
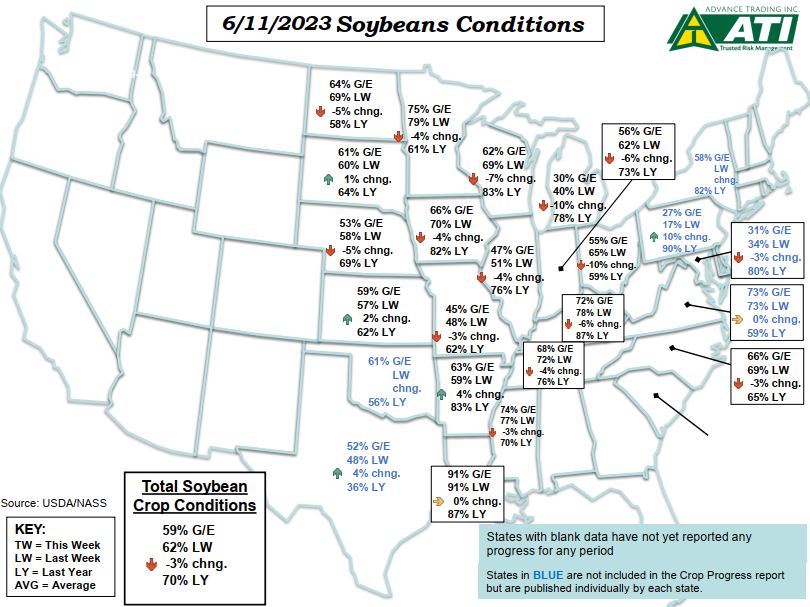
Hot and dry weather is taking its toll on crop condition scores as they deteriorated again this week. Corn conditions slid to 61% good-excellent vs. 64% last week and 72% last year. Soybean conditions dropped to 59% good-excellent vs. 62% last week and 70% last year.
| Conditions (Good + Excellent) | |
| Corn Conditions | G/E: 61% TW vs. 64% LW, 72% LY |
| Soybean Conditions | G/E: 59% TW vs. 62% LW, 70% LY |
| Milo Conditions | G/E: 57% TW vs. (NA)% LW, 47% LY |
| Winter Wheat Conditions | G/E: 38% TW vs. 36% LW, 31% LY |
| Spring Wheat Conditions | G/E: 60% TW vs. 64% LW, 54% LY |
| Crop Progress Summary | |
| Corn Emerged | 93% TW vs. 85% LW, 87% LY, 87% AVG |
| Soybean Planted | 96% TW vs. 91% LW, 87% LY, 86% AVG |
| Soybean Emerged | 86% TW vs. 74% LW, 68% LY, 70% AVG |
| Milo Planted | 64% TW vs. 49% LW, 65% LY, 68% AVG |
| Winter Wheat Headed | 89% TW vs. 82% LW, 85% LY, 88% AVG |
| Winter Wheat Harvested | 8% TW vs. 4% LW, 9% LY, 9% AVG |
| Spring Wheat Planted | 97% TW vs. 93% LW, 92% LY, 97% AVG |
| Spring Wheat Emerged | 90% TW vs. 76% LW, 70% LY, 87% AVG |
| Source: USDA/NASS |
Read the complete NASS report here
Graphics courtesy of Advance Trading, Inc.
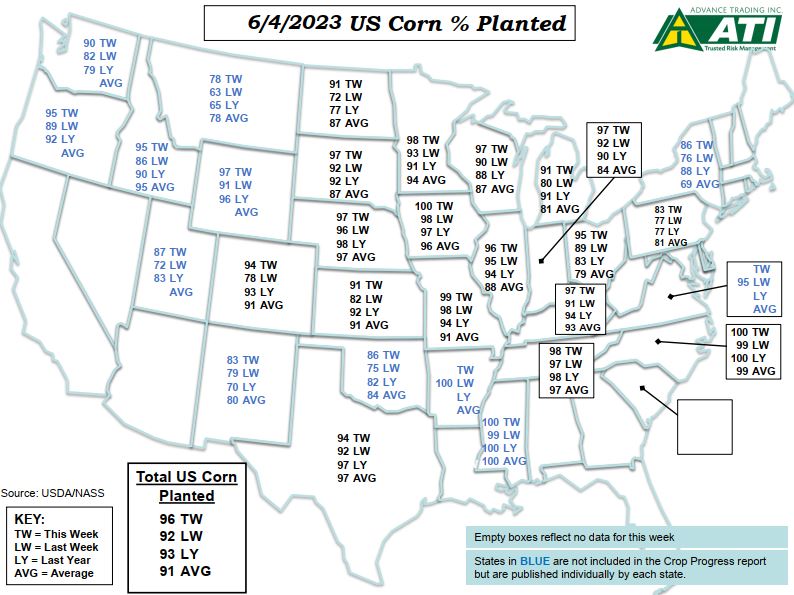
June 4th Crop Progress Report
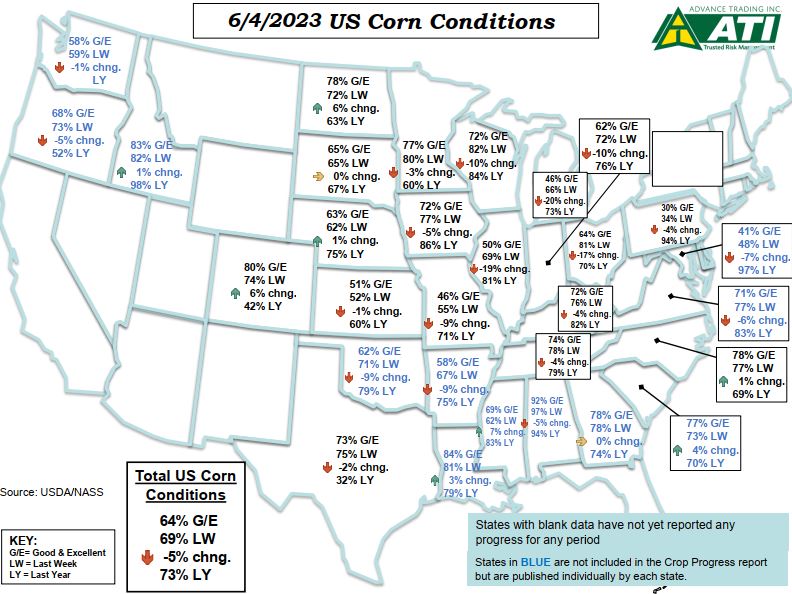
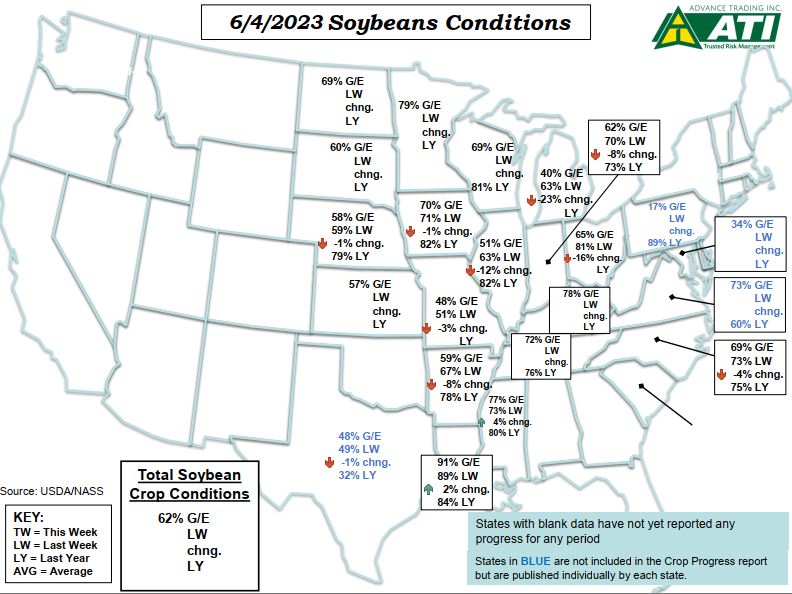
Hot/dry conditions are already showing up in crop condition scores. Corn conditions dropped 5% this week and were rated 64% good-excellent vs. 69% last week and 73% last year. The initial soybean condition scores for the year were released today and the crop is rated 62% good-excellent.
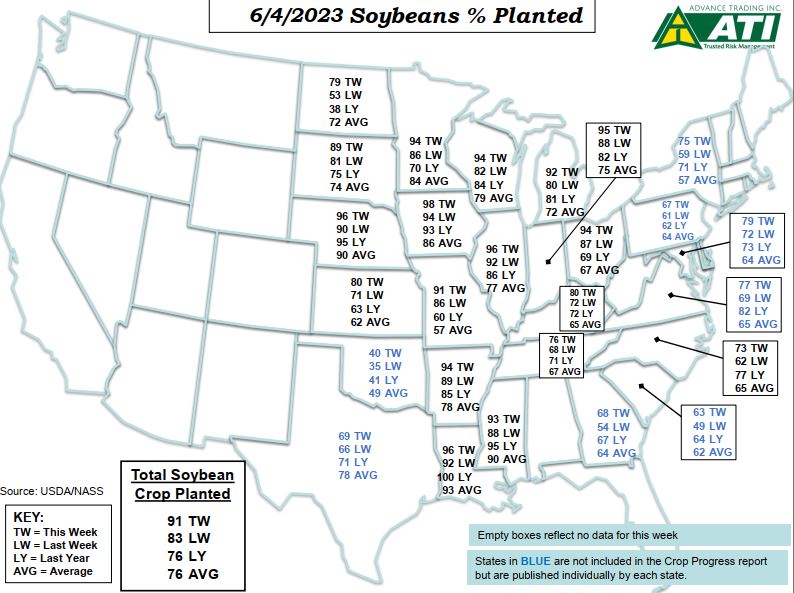
Planting is getting close to complete and prevent plant concerns are minimal. Corn planting is 96% complete vs. 93% last year and 91% on average. Soybean planting is 91% complete vs. 76% last year and 76% on average.
| Conditions (Good + Excellent) | |
| Corn Conditions | G/E: 64% TW vs. 69% LW, 73% LY |
| Soybean Conditions | G/E: 62% TW vs. NA LW, NA LY |
| Winter Wheat Conditions | G/E: 36% TW vs. 34% LW, 30% LY |
| Spring Wheat Conditions | G/E: 64% TW vs. NA LW, NA LY |
| Crop Progress Summary | |
| Corn Planted | 96% TW vs. 92% LW, 93% LY, 91% AVG |
| Corn Emerged | 85% TW vs. 72% LW, 76% LY, 77% AVG |
| Soybean Planted | 91% TW vs. 83% LW, 76% LY, 76% AVG |
| Soybean Emerged | 74% TW vs. 56% LW, 54% LY, 56% AVG |
| Milo Planted | 49% TW vs. 42% LW, 54% LY, 53% AVG |
| Winter Wheat Headed | 82% TW vs. 72% LW, 78% LY, 81% AVG |
| Winter Wheat Harvested | 4% TW vs. (NA)% LW, 5% LY, 4% AVG |
| Spring Wheat Planted | 93% TW vs. 85% LW, 81% LY, 93% AVG |
| Spring Wheat Emerged | 76% TW vs. 57% LW, 53% LY, 74% AVG |
| Source: USDA/NASS |
Read the complete NASS report here
Graphics courtesy of Advance Trading, Inc
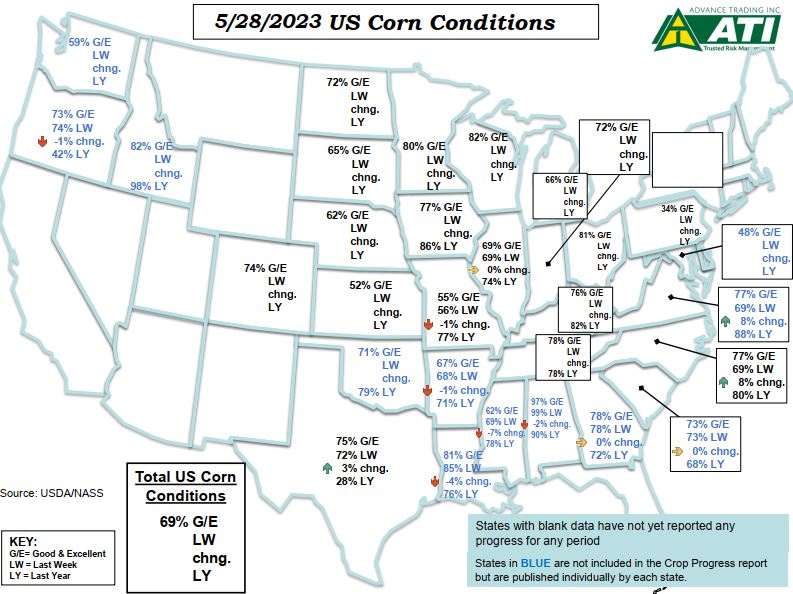
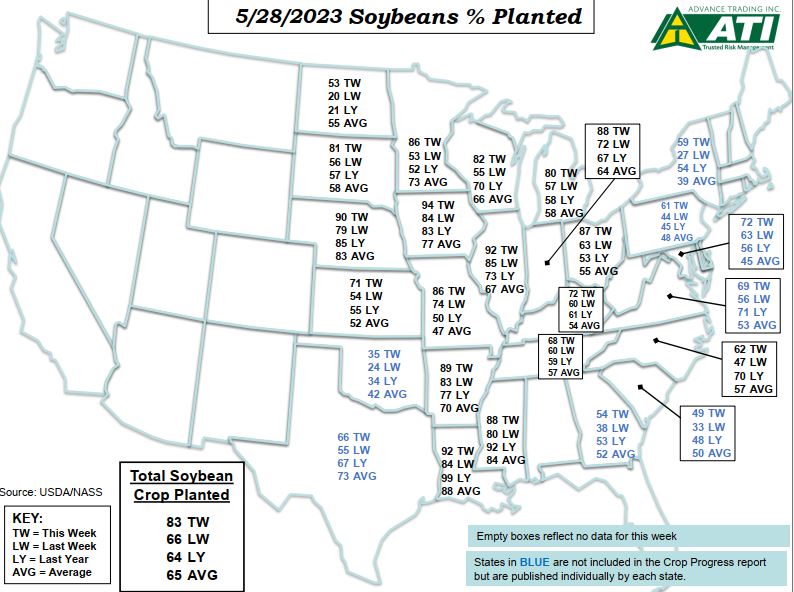
May 28th Crop Progress Report
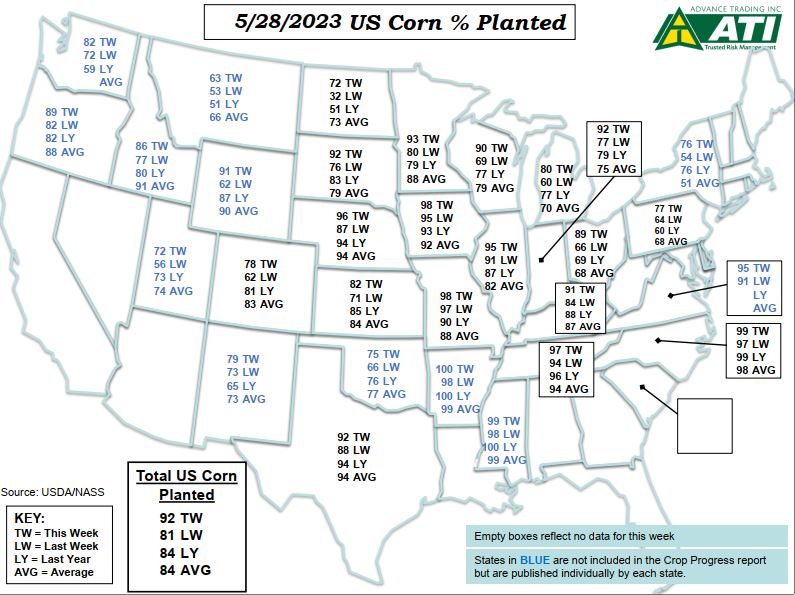
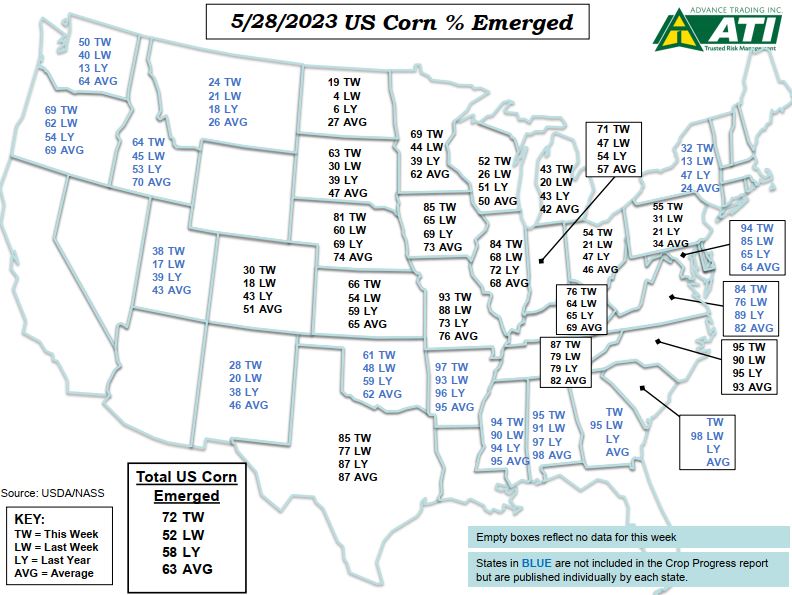
Planters have been working overtime to get the crop in the ground. Corn planted reached 92% complete this week vs. 84% last year and 82% on average. Corn emerged is at 72% this week vs. 58% last year and 63% on average. North Dakota was a concern with how slow the progress has been there but they had a huge week planting 40% of their crop to catch up to the average.
Soybean planting is 83% complete vs. 64% last year and 65% on average. Soybeans emerged are at 56% vs. 36% last year and 40% on average.
This report featured the first national crop condition scores of the year. The corn crop is rated 69% good-excellent. Notably, Minnesota is rated 80% good-excellent and Wisconsin is rated 82% good-excellent.
| Conditions (Good + Excellent) | |
| Corn Conditions | G/E: 69% TW vs. NA LW, 73% LY |
| Winter Wheat Conditions | G/E: 34% TW vs. 31% LW, 29% LY |
| Crop Progress Summary | |
| Corn Planted | 92% TW vs. 81% LW, 84% LY, 84% AVG |
| Corn Emerged | 72% TW vs. 52% LW, 58% LY, 63% AVG |
| Soybean Planted | 83% TW vs. 66% LW, 64% LY, 65% AVG |
| Soybean Emerged | 56% TW vs. 36% LW, 36% LY, 40% AVG |
| Milo Planted | 42% TW vs. 33% LW, 39% LY, 41% AVG |
| Winter Wheat Headed | 72% TW vs. 61% LW, 71% LY, 73% AVG |
| Spring Wheat Planted | 85% TW vs. 64% LW, 70% LY, 86% AVG |
| Spring Wheat Emerged | 57% TW vs. 32% LW, 40% LY, 59% AVG |
| Source: USDA/NASS |
Read the complete NASS report here
Graphics courtesy of Advance Trading, Inc.
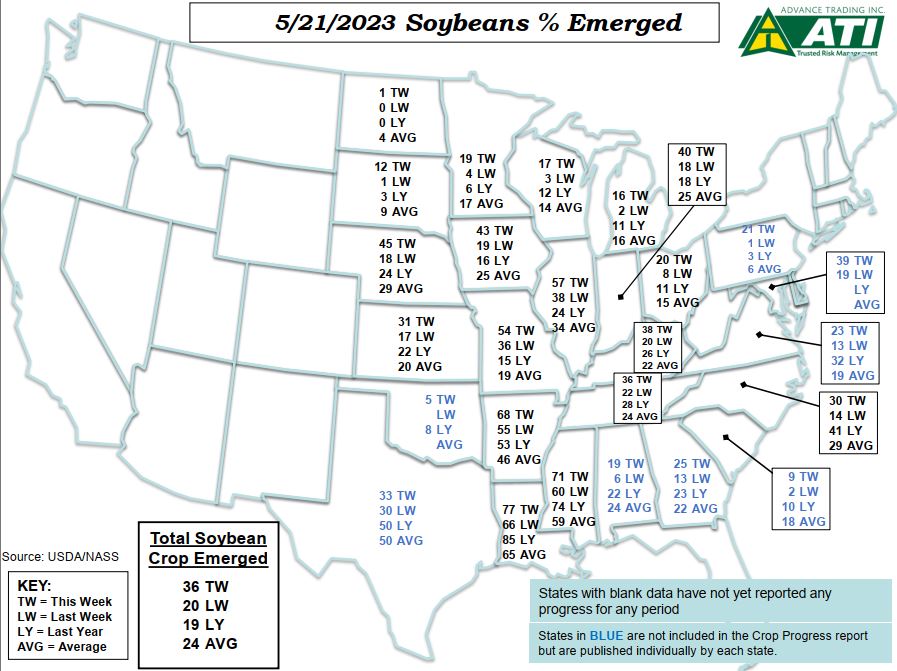
May 21st Crop Progress Report
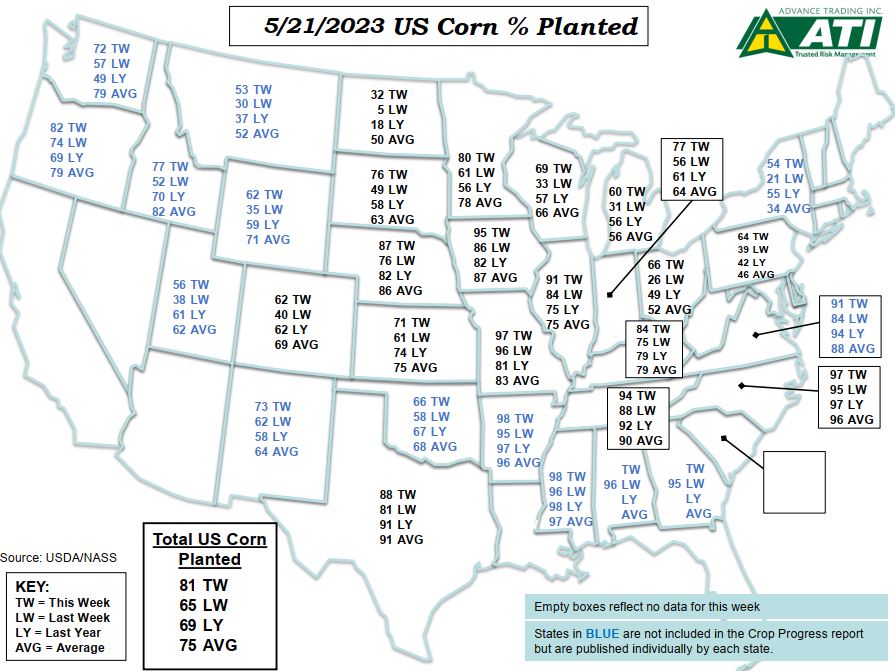
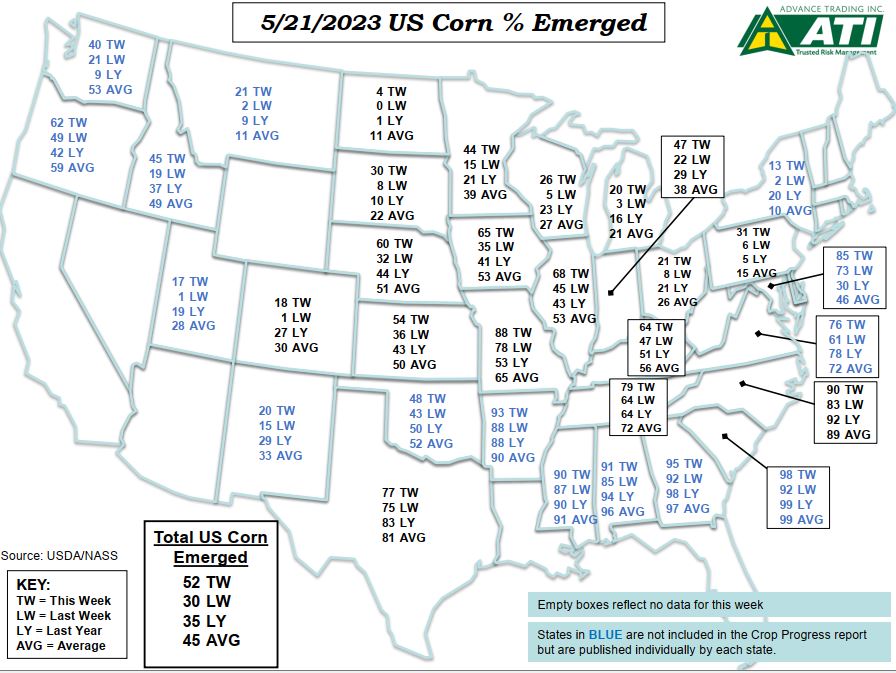

Corn planting reached 81% complete in this week’s report which compares to 69% last year and 75% on the 5-year average. Corn emergence is also ahead of average at 52% this week vs. 35% last year and 45% on average.
Soybean planting is 66% complete vs. 47% last year and 52% on average. Soybeans emerged is at 36% vs. 19% last year and 24% on average.
In general, the northern tier of states and Ohio remain behind the pace of the other states. North Dakota is the biggest concern as their prevent plant dates are coming soon.
| Conditions (Good + Excellent) | |
| Winter Wheat Conditions | G/E: 31% TW vs. 29% LW, 28% LY |
| Crop Progress Summary | |
| Corn Planted | 81% TW vs. 65% LW, 69% LY, 75% AVG |
| Corn Emerged | 52% TW vs. 30% LW, 35% LY, 45% AVG |
| Soybean Planted | 66% TW vs. 49% LW, 47% LY, 52% AVG |
| Soybean Emerged | 36% TW vs. 20% LW, 19% LY, 24% AVG |
| Milo Planted | 33% TW vs. 28% LW, 32% LY, 33% AVG |
| Winter Wheat Headed | 61% TW vs. 49% LW, 61% LY, 61% AVG |
| Spring Wheat Planted | 64% TW vs. 40% LW, 48% LY, 73% AVG |
| Spring Wheat Emerged | 32% TW vs. 13% LW, 27% LY, 40% AVG |
| Source: USDA/NASS |
Read the complete NASS report here
Graphics courtesy of Advance Trading Inc.
May 14th Crop Progress Report
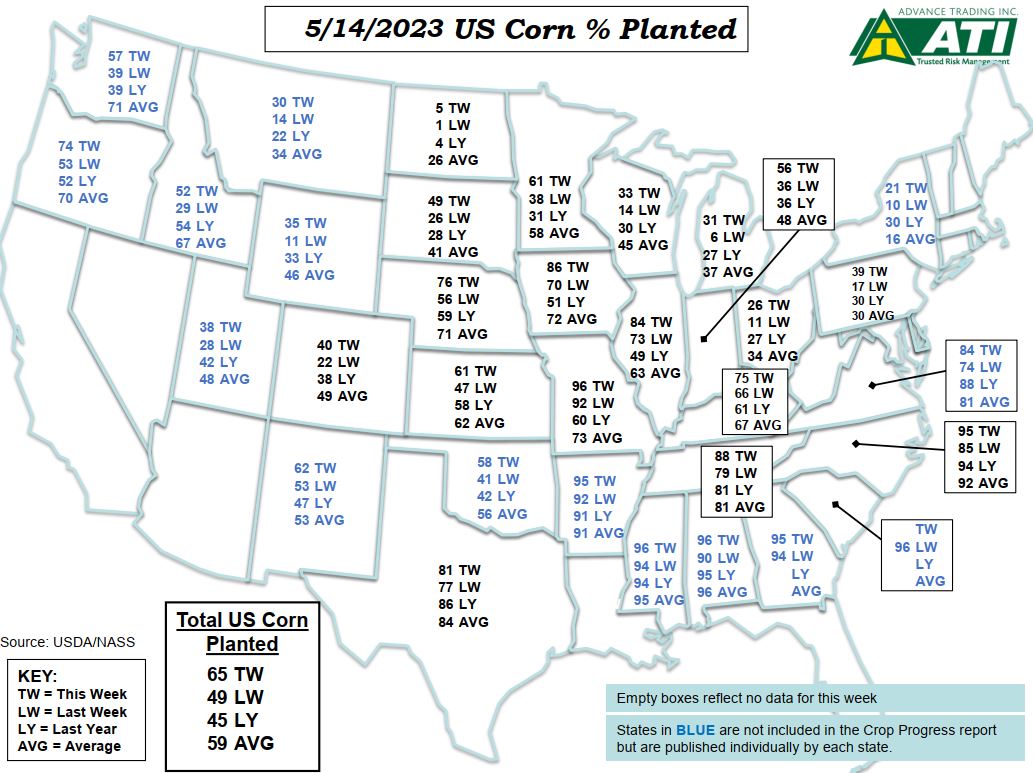

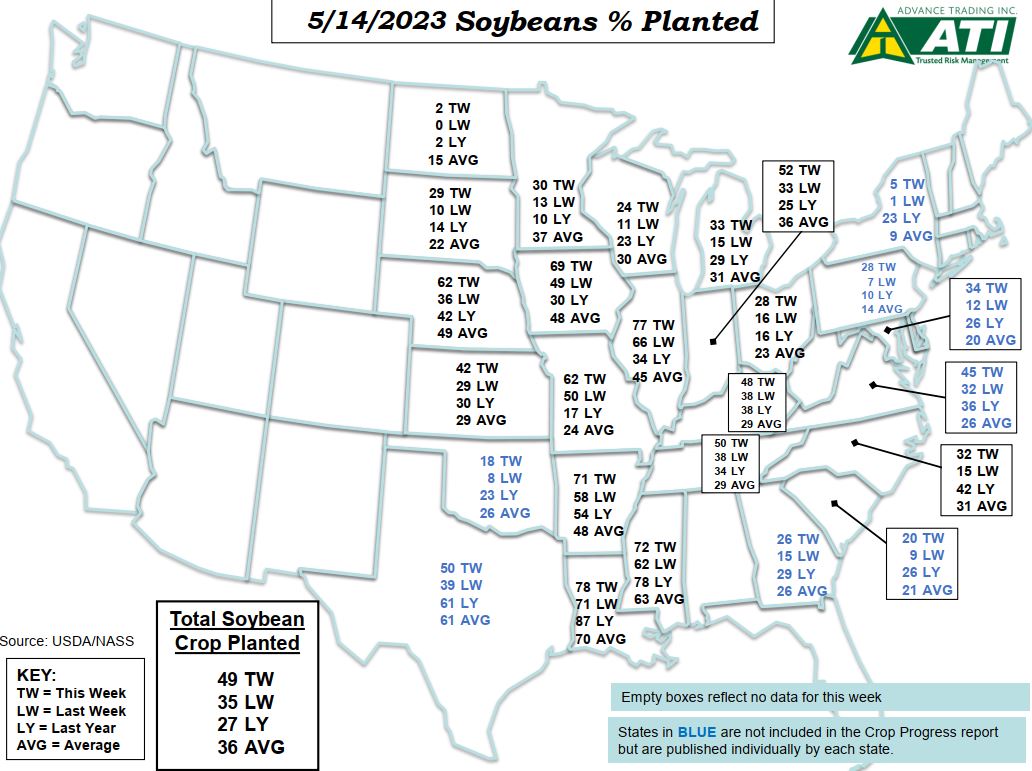
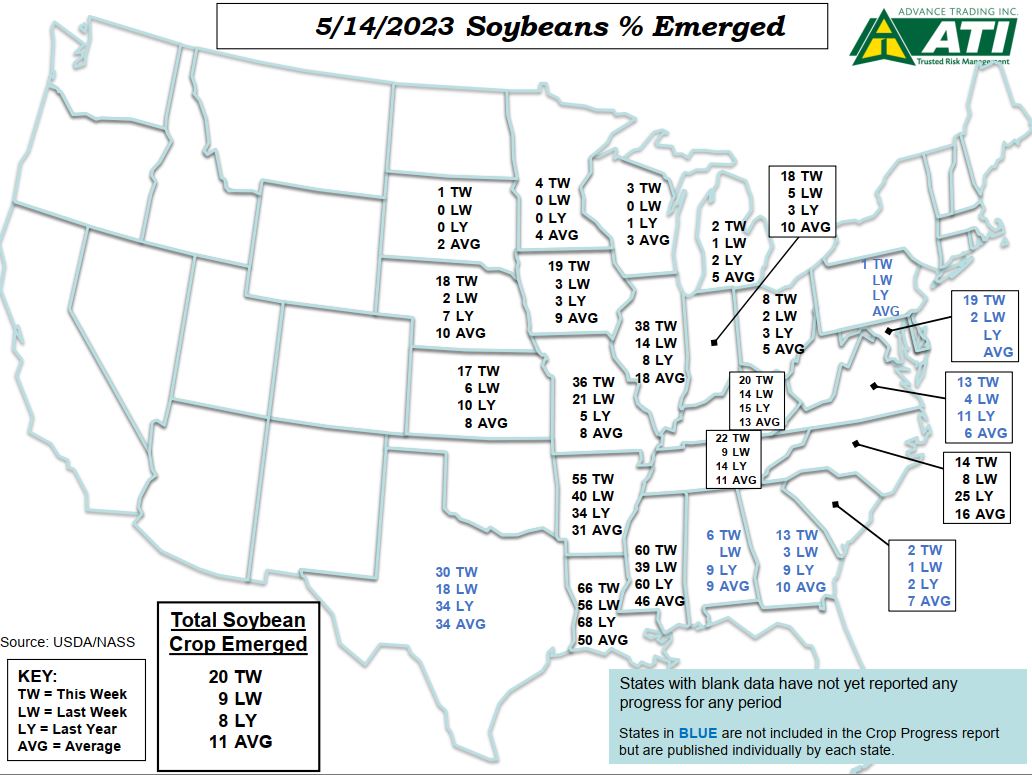
National corn and soybean planting progress made another leap forward in the past week and is maintaining its pace ahead of the 5-year average pace. Corn planting is 65% complete vs. 45% last year and 59% on average. Soybean planting is 49% complete vs. 27% last year and 35% on average. North Dakota stands out as struggling with a late spring and very little progress so far to report.
Corn and soybean emergence is coming along well and soon we will get national crop condition scores.
| Conditions (Good + Excellent) | |
| Winter Wheat Conditions | G/E: 29% TW vs. 29% LW, 27% LY |
| Crop Progress Summary | |
| Corn Planted | 65% TW vs. 49% LW, 45% LY, 59% AVG |
| Corn Emerged | 30% TW vs. 12% LW, 13% LY, 25% AVG |
| Soybean Planted | 49% TW vs. 35% LW, 27% LY, 36% AVG |
| Soybean Emerged | 20% TW vs. 9% LW, 8% LY, 11% AVG |
| Milo Planted | 28% TW vs. 24% LW, 25% LY, 28% AVG |
| Winter Wheat Headed | 49% TW vs. 38% LW, 46% LY, 48% AVG |
| Spring Wheat Planted | 40% TW vs. 24% LW, 37% LY, 57% AVG |
| Spring Wheat Emerged | 13% TW vs. 5% LW, 15% LY, 23% AVG |
| Source: USDA/NASS |
Read the complete NASS report here
Graphics courtesy of Advance Trading, Inc.
May 7th Crop Progress Report
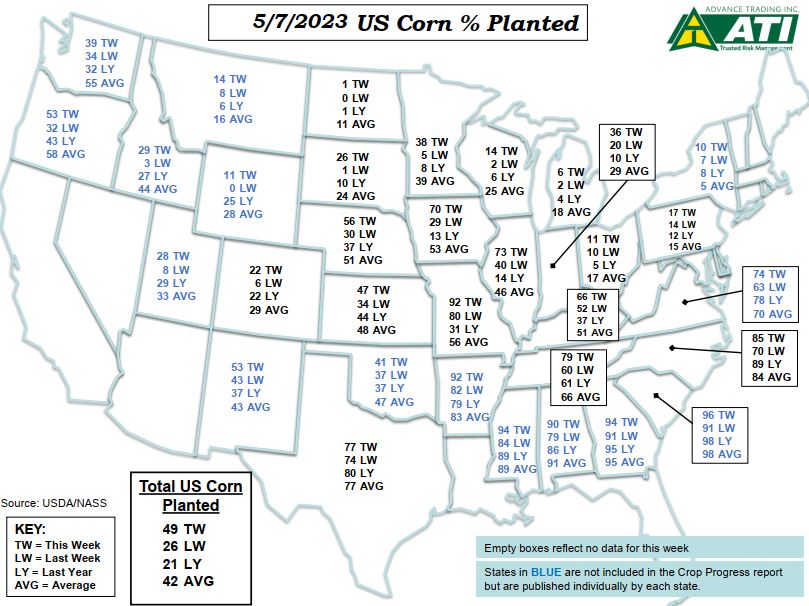
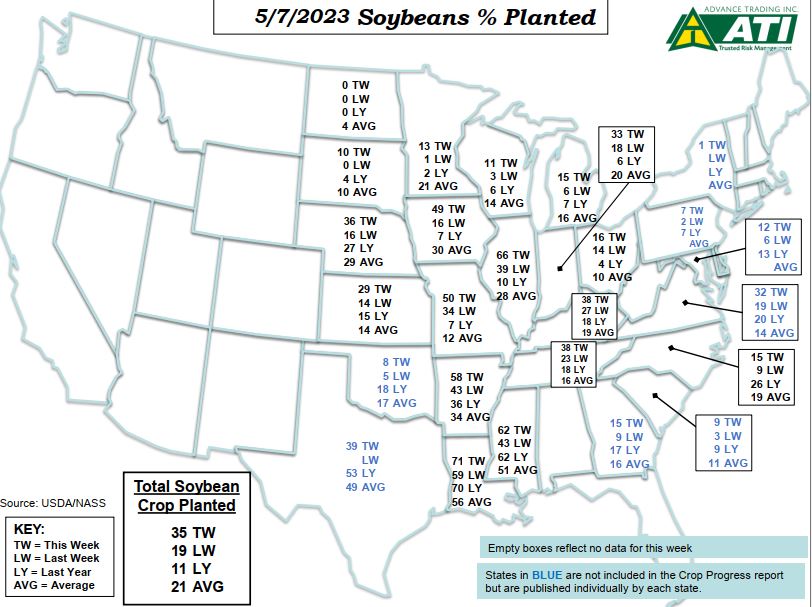
The first week of May offered active planting activity across the country. Corn planting is 49% complete vs. 21% last year and 42% on average. Minnesota is 38% planted just 1% below average with 30% of that accomplished in the past week. Soybean planting is 35% complete vs. 11% last year and 21% on average.
| Conditions (Good + Excellent) | |
| Winter Wheat Conditions | G/E: 29% TW vs. 28% LW, 29% LY |
| Crop Progress Summary | |
| Corn Planted | 49% TW vs. 26% LW, 21% LY, 42% AVG |
| Corn Emerged | 12% TW vs. 6% LW, 5% LY, 11% AVG |
| Soybean Planted | 35% TW vs. 19% LW, 11% LY, 21% AVG |
| Soybean Emerged | 9% TW vs. (NA)% LW, 3% LY, 4% AVG |
| Milo Planted | 24% TW vs. 21% LW, 22% LY, 24% AVG |
| Winter Wheat Headed | 38% TW vs. 25% LW, 32% LY, 35% AVG |
| Spring Wheat Planted | 24% TW vs. 12% LW, 26% LY, 38% AVG |
| Spring Wheat Emerged | 5% TW vs. 2% LW, 8% LY, 11% AVG |
| Source: USDA/NASS |
Read the complete NASS report here
Graphics courtesy of Advance Trading, Inc.
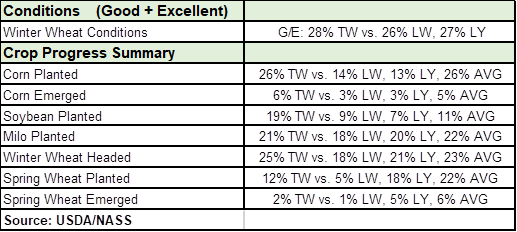
April 30th Crop Progress Report
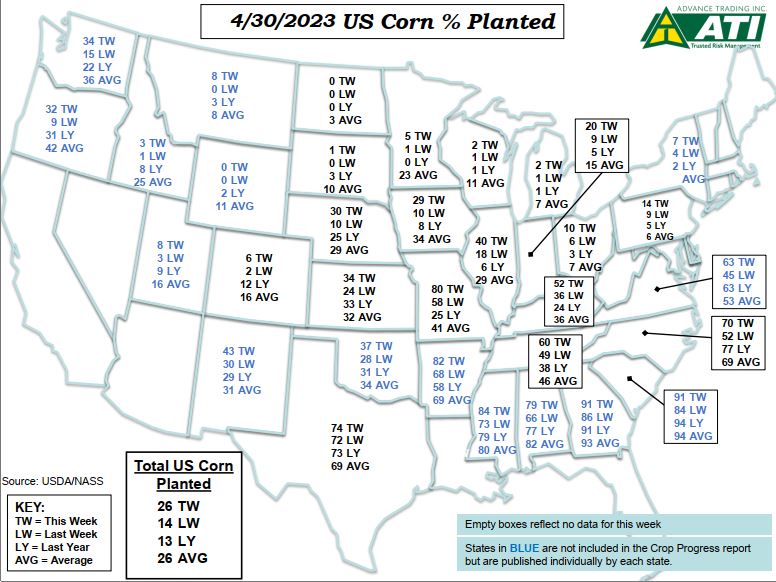
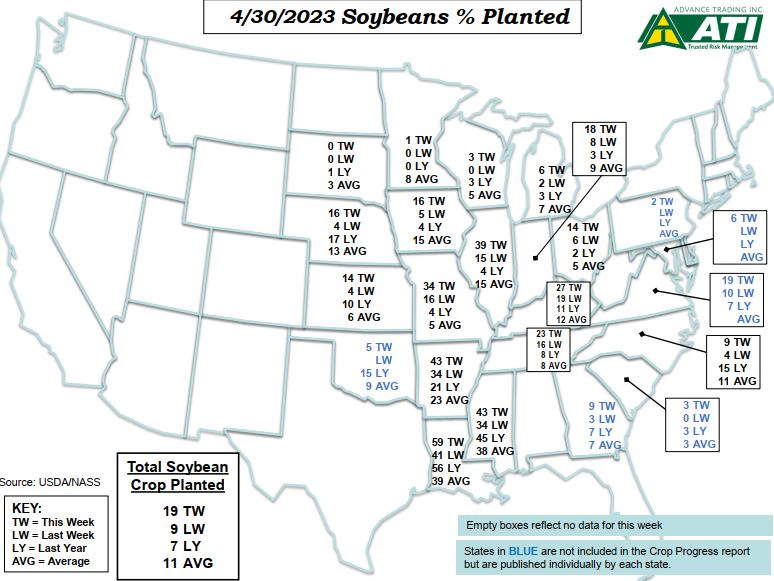
National corn and soybean planting progress was reported to be at or above the 5-year average pace once again. Although there is a clear difference between the northern tier of states and the rest of the country as the slow warm up in the north has planting off to a slower than average start. Corn planting is 26% complete vs. 13% last year and 26% on average. Soybean planting is 19% complete vs. 7% last year and 11% on average.
Read the complete NASS report here
Graphics courtesy of Advance Trading Inc.
April 23rd Crop Progress Report
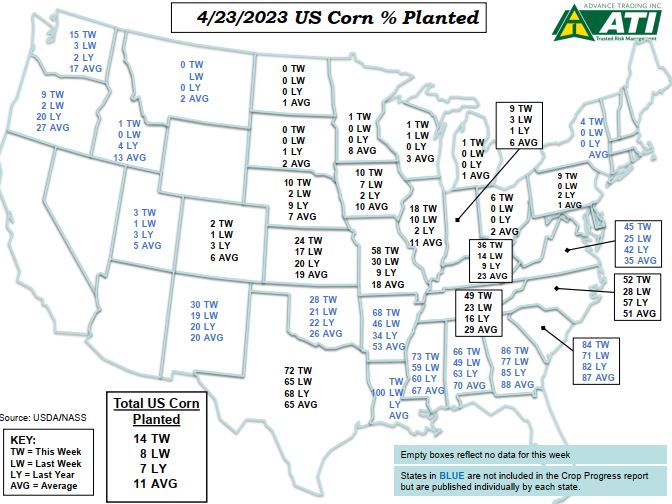
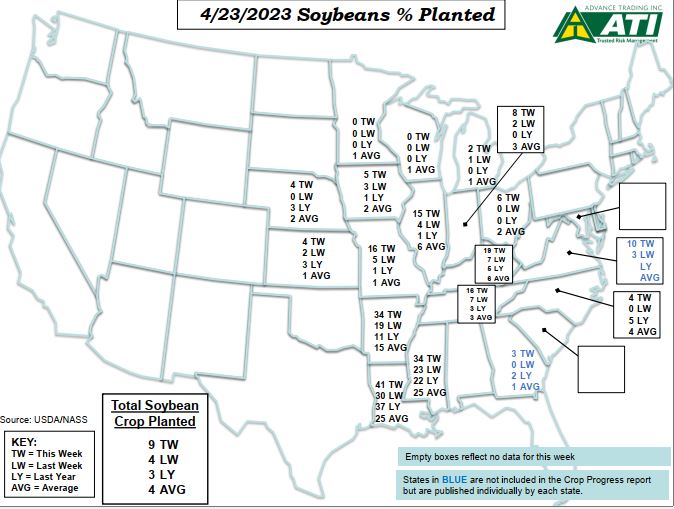
Corn and soybean planting continued ahead of the 5-year average pace for this week as southern states continue to get the crop in the ground vs the slow start in the northern states. Corn planting is 14% complete vs. 7% last year and 11% on average. Soybean planting is 9% complete vs. 3% last year and 4% on average.
| Conditions (Good + Excellent) | |
| Winter Wheat Conditions | G/E: 26% TW vs. 27% LW, 27% LY |
| Crop Progress Summary | |
| Corn Planted | 14% TW vs. 8% LW, 7% LY, 11% AVG |
| Corn Emerged | 3% TW vs. (NA)% LW, 2% LY, 2% AVG |
| Soybean Planted | 9% TW vs. 4% LW, 3% LY, 4% AVG |
| Milo Planted | 18% TW vs. 15% LW, 19% LY, 20% AVG |
| Winter Wheat Headed | 18% TW vs. 10% LW, 10% LY, 14% AVG |
| Spring Wheat Planted | 5% TW vs. 3% LW, 12% LY, 12% AVG |
| Spring Wheat Emerged | 1% TW vs. (NA)% LW, 2% LY, 3% AVG |
| Source: USDA/NASS |
Read the complete NASS report here
Graphics courtesy of Advance Trading, Inc
April 16th Crop Progress Report
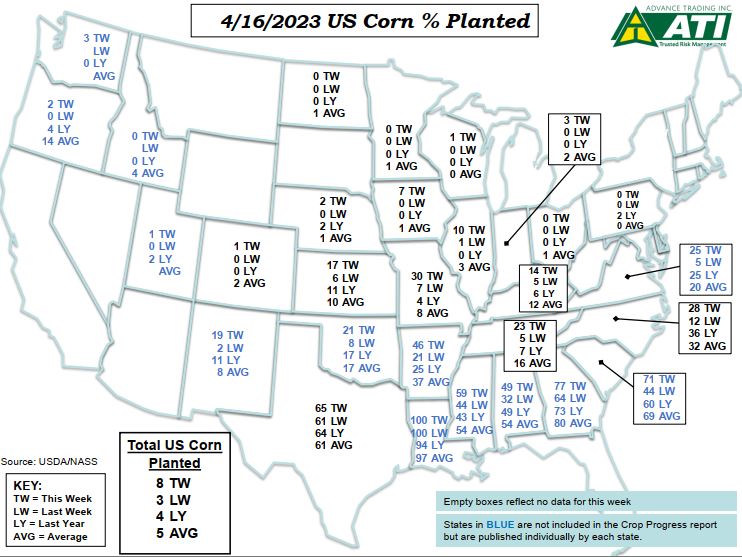

The 2023 US corn and soybean crop season is underway! NASS is reporting 8% of the crop is planted vs. 4% last year and 5% on average. 4% of the soybean crop is planted vs. 1% last year and 1% on average. Illinois and Missouri got a jump on soybean planting with the good weather.
| Conditions (Good + Excellent) | |
| Winter Wheat Conditions | G/E: 27% TW vs. 28% LW, 32% LY |
| Crop Progress Summary | |
| Corn Planted | 8% TW vs. 3% LW, 4% LY, 5% AVG |
| Soybean Planted | 4% TW vs. (NA)% LW, 1% LY, 1% AVG |
| Milo Planted | 15% TW vs. 13% LW, 17% LY, 17% AVG |
| Winter Wheat Headed | 10% TW vs. 7% LW, 7% LY, 8% AVG |
| Spring Wheat Planted | 3% TW vs. 1% LW, 8% LY, 7% AVG |
| Source: USDA/NASS |
Read the complete NASS report here
Graphics courtesy of Advance Trading Inc.