
October 2nd Crop Progress Report

| Conditions (Good + Excellent) | |
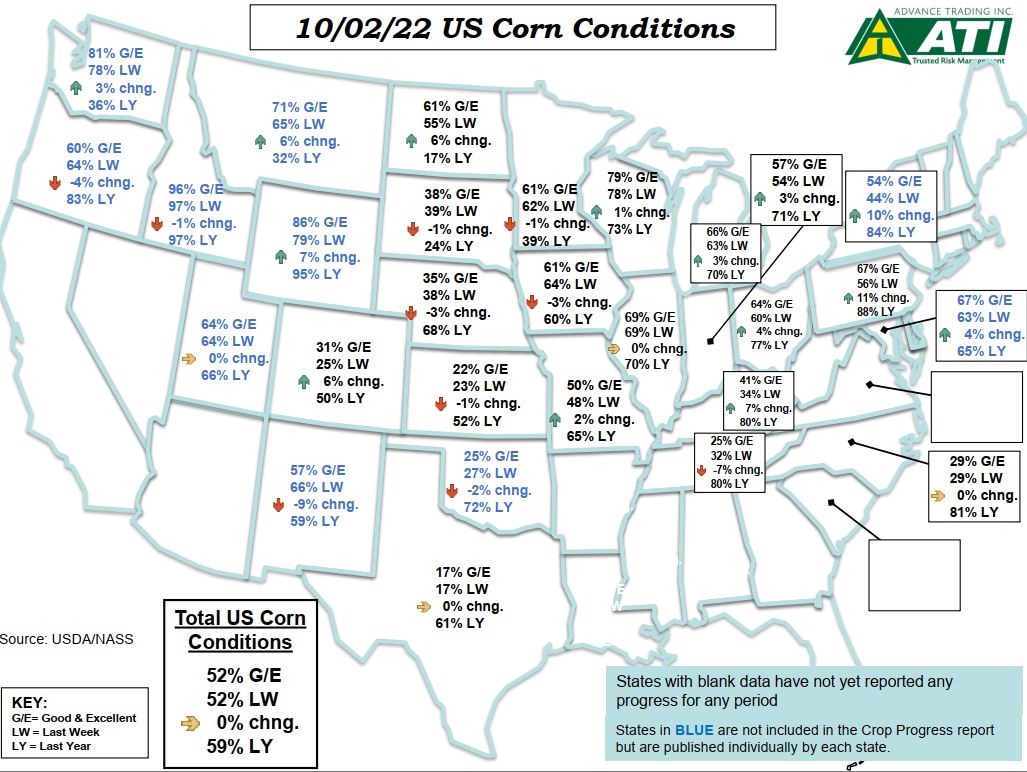
| Corn Conditions | G/E: 52% TW vs. 52% LW, 59% LY |
| Soybean Conditions | G/E: 55% TW vs. 55% LW, 58% LY |
| Milo Conditions | G/E: 20% TW vs. 22% LW, 56% LY |
| Crop Progress Summary | |
| Corn Dented | 96% TW vs. 92% LW, 100% LY, 97% AVG |
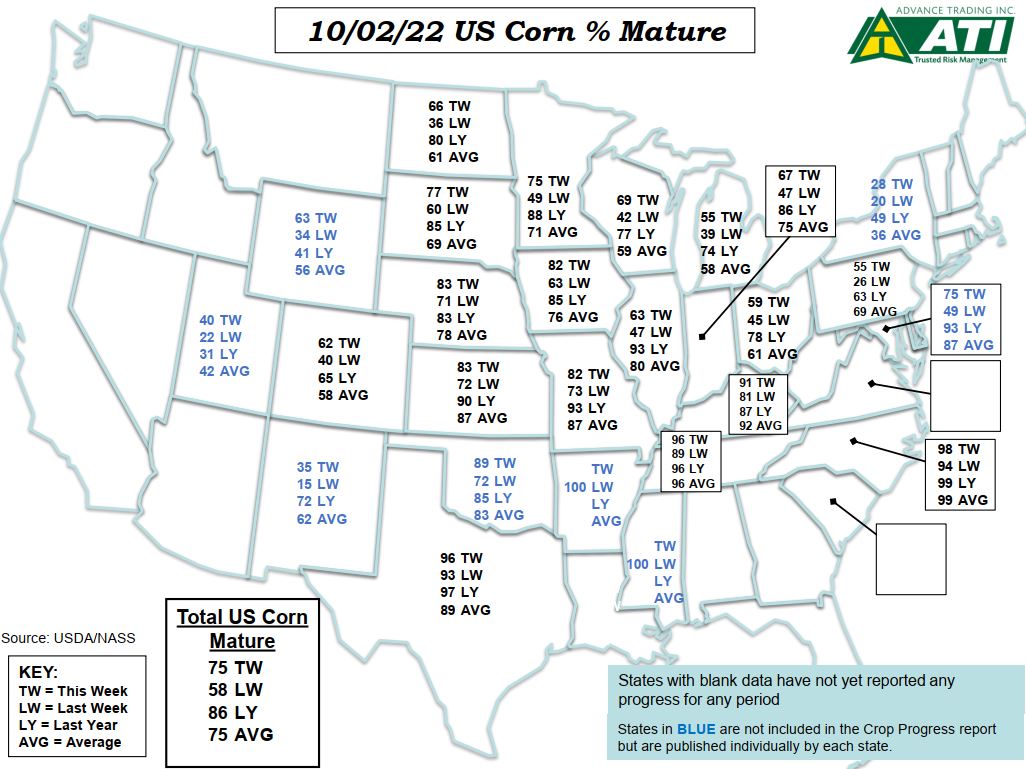
| Corn Mature | 75% TW vs. 58% LW, 86% LY, 75% AVG |
| Corn Harvested | 20% TW vs. 12% LW, 27% LY, 22% AVG |
| Soybean Dropping Leaves | 81% TW vs. 63% LW, 84% LY, 79% AVG |
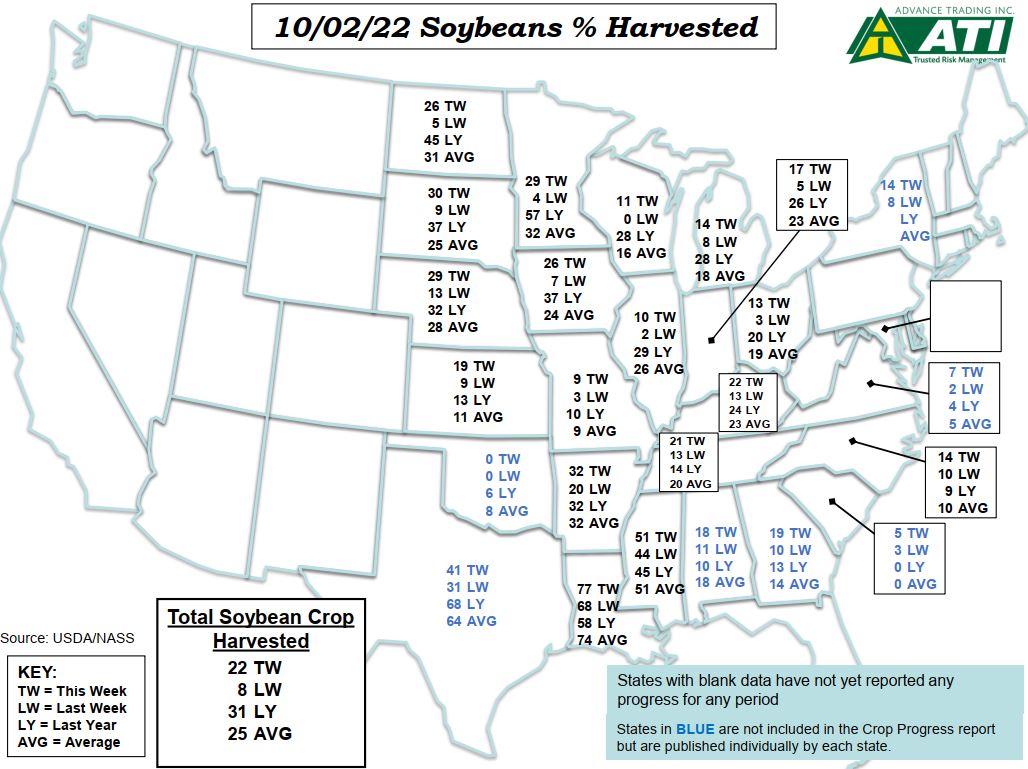
| Soybean Harvested | 22% TW vs. 8% LW, 31% LY, 25% AVG |
| Milo Coloring | 96% TW vs. 91% LW, 99% LY, 97% AVG |
| Milo Mature | 69% TW vs. 56% LW, 77% LY, 67% AVG |
| Milo Harvested | 34% TW vs. 27% LW, 37% LY, 35% AVG |
| Winter Wheat Planted | 40% TW vs. 31% LW, 45% LY, 44% AVG |
| Winter Wheat Emerged | 15% TW vs. 9% LW, 18% LY, 17% AVG |
| Source: USDA/NASS |
Read the complete NASS report here
Graphics courtesy of Advance Trading Inc
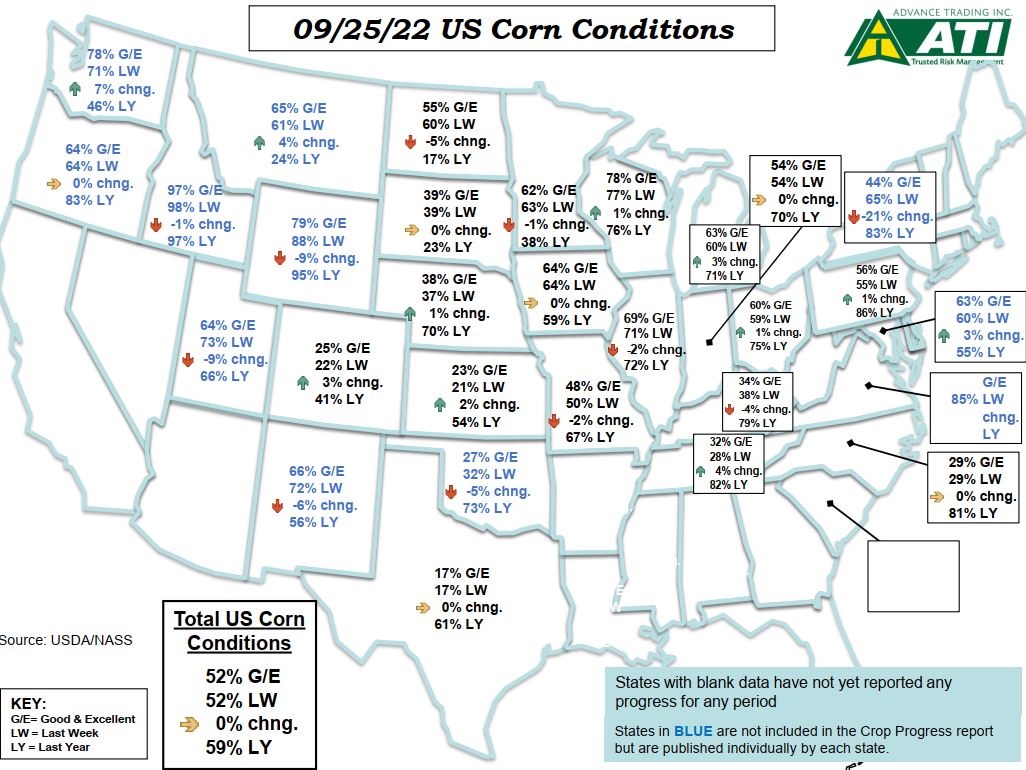
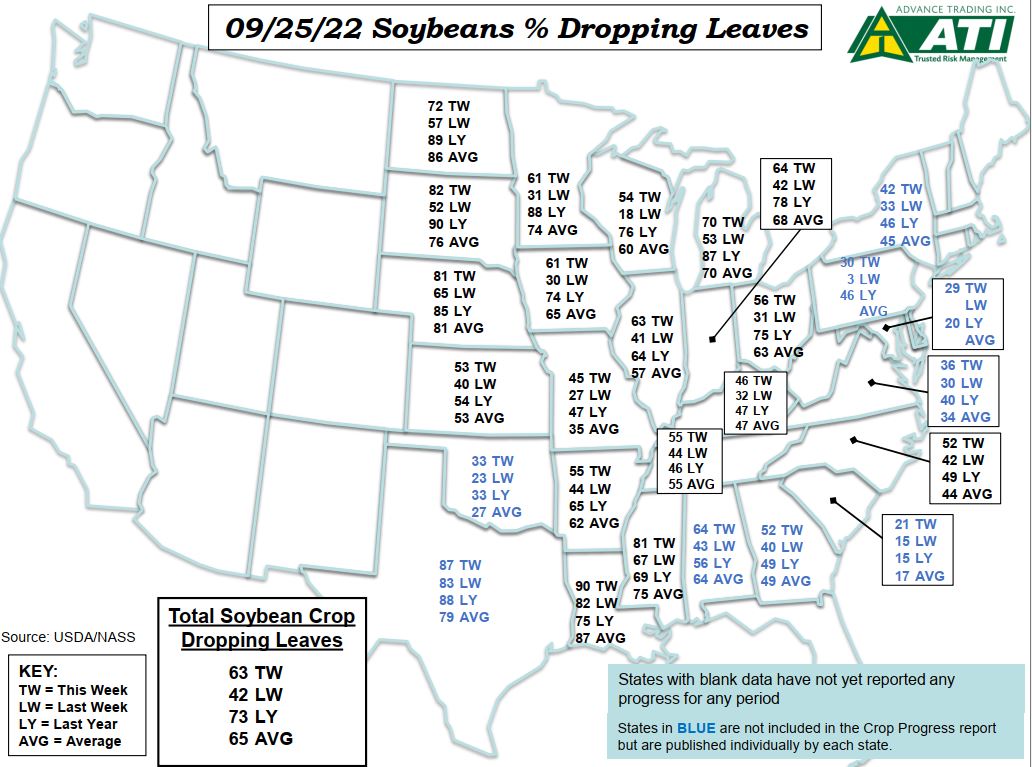
September 25th Crop Progress Report

| Conditions (Good + Excellent) | |
| Corn Conditions | G/E: 52% TW vs. 52% LW, 59% LY |
| Soybean Conditions | G/E: 55% TW vs. 55% LW, 58% LY |
| Milo Conditions | G/E: 22% TW vs. 20% LW, 56% LY |
| Crop Progress Summary | |
| Corn Dented | 92% TW vs. 87% LW, 96% LY, 94% AVG |
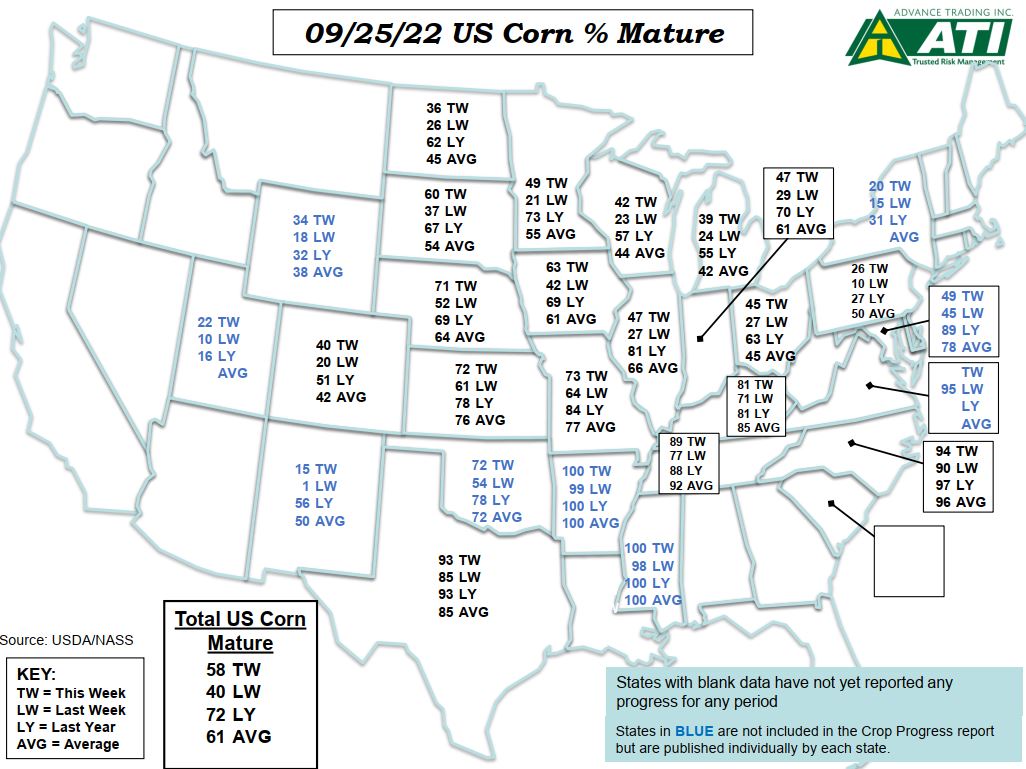
| Corn Mature | 58% TW vs. 40% LW, 72% LY, 61% AVG |
| Corn Harvested | 12% TW vs. 7% LW, 17% LY, 14% AVG |
| Soybean Dropping Leaves | 63% TW vs. 42% LW, 73% LY, 65% AVG |
| Soybean Harvested | 8% TW vs. 3% LW, 15% LY, 13% AVG |
| Milo Coloring | 91% TW vs. 85% LW, 95% LY, 94% AVG |
| Milo Mature | 56% TW vs. 44% LW, 63% LY, 55% AVG |
| Milo Harvested | 27% TW vs. 24% LW, 30% LY, 30% AVG |
| Winter Wheat Planted | 31% TW vs. 21% LW, 32% LY, 30% AVG |
| Winter Wheat Emerged | 9% TW vs. 2% LW, 8% LY, 6% AVG |
| Spring Wheat Harvested | 96% TW vs. 94% LW, 100% LY, 97% AVG |
| Source: USDA/NASS |
Read the complete NASS report here
Graphics courtesy of Advance Trading Inc
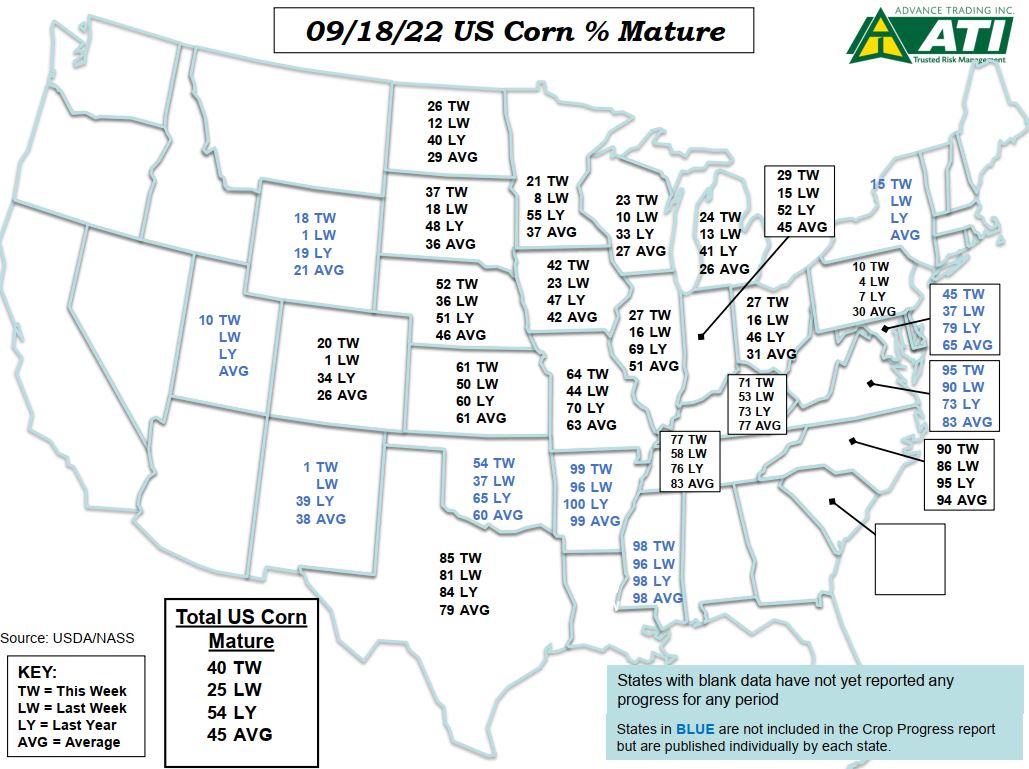
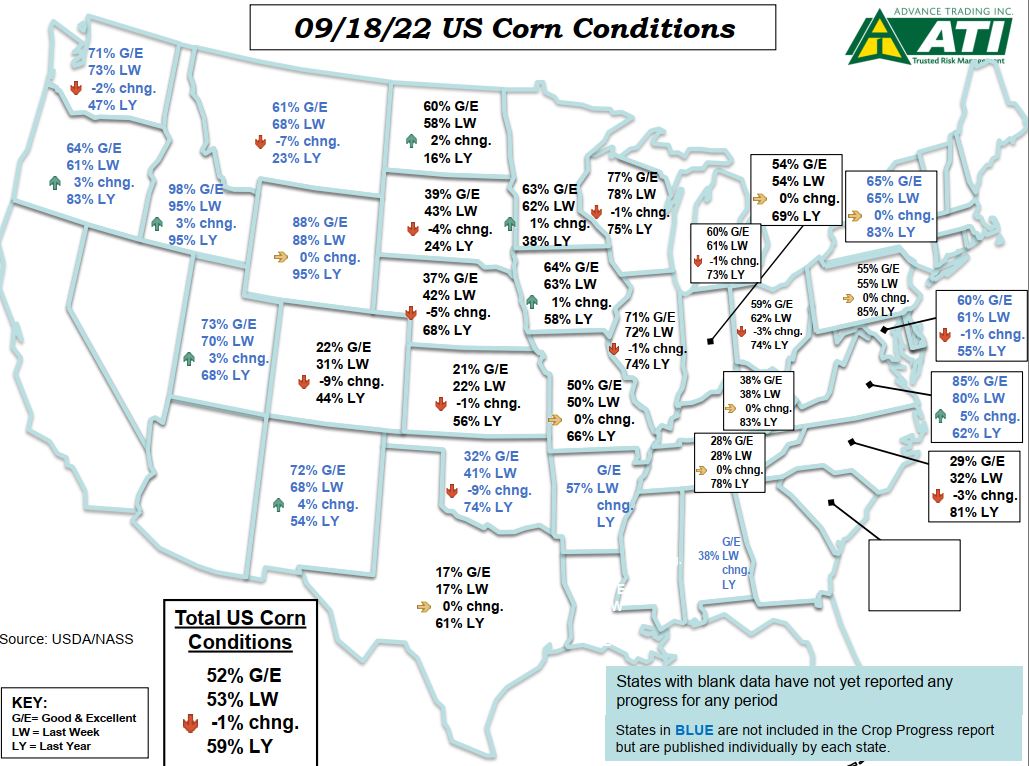
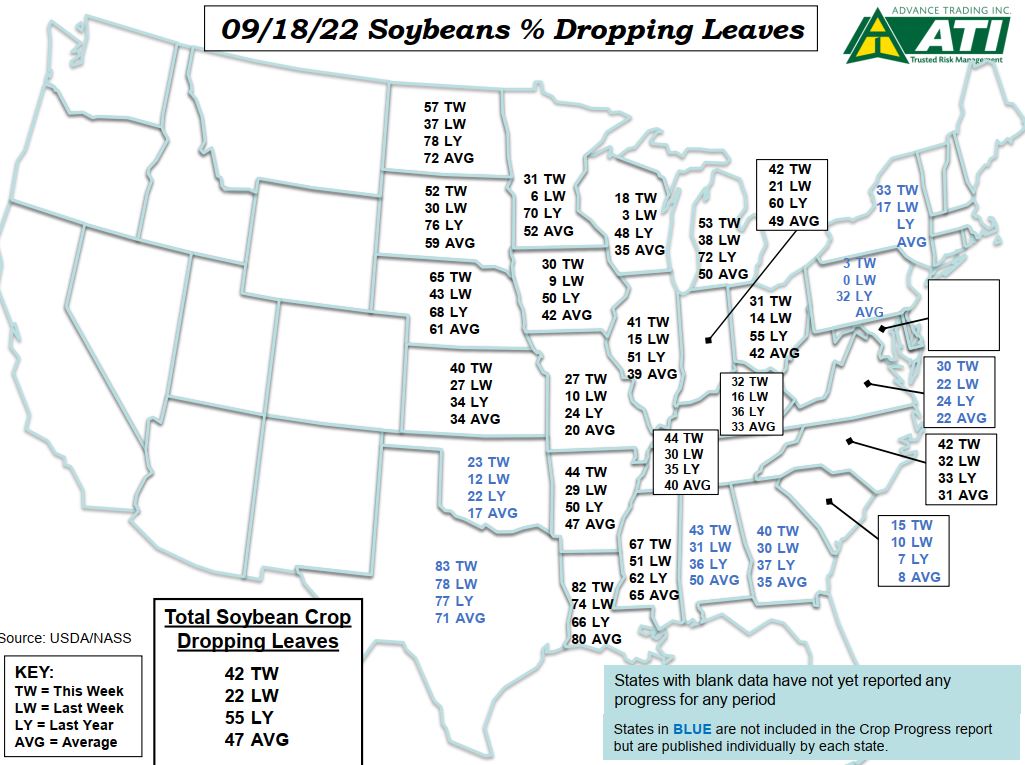
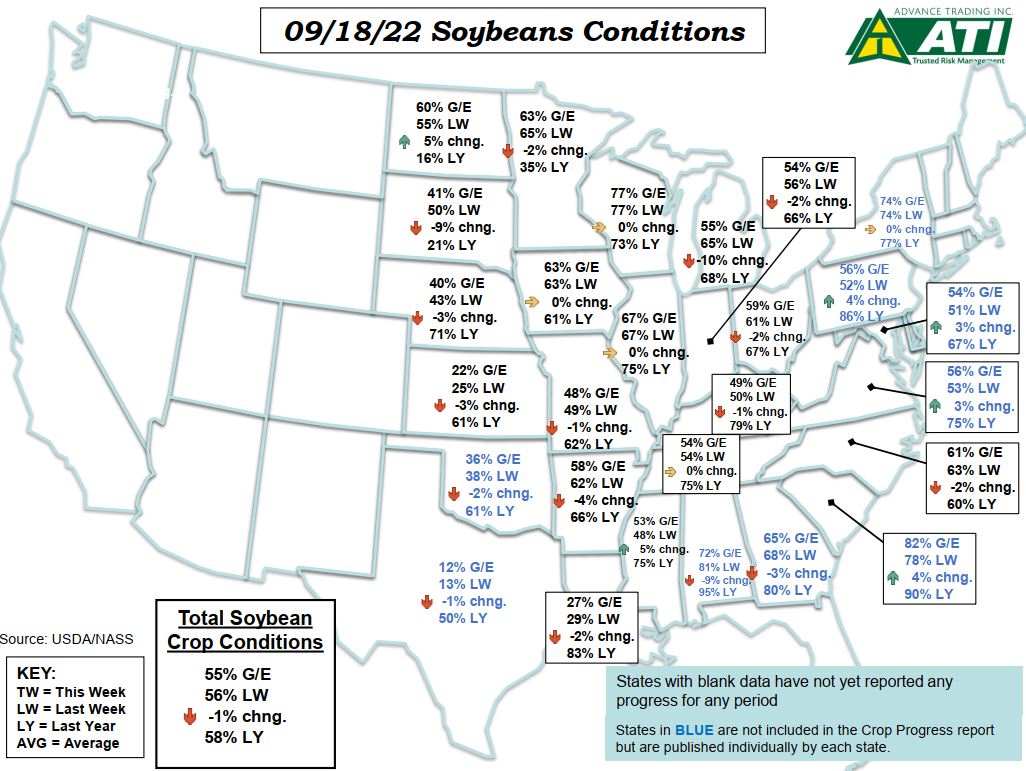
September 18th Crop Progress Report
| Conditions (Good + Excellent) | |
| Corn Conditions | G/E: 52% TW vs. 53% LW, 59% LY |
| Soybean Conditions | G/E: 55% TW vs. 56% LW, 58% LY |
| Milo Conditions | G/E: 20% TW vs. 20% LW, 56% LY |
| Crop Progress Summary | |
| Corn Dented | 87% TW vs. 77% LW, 92% LY, 88% AVG |
| Corn Mature | 40% TW vs. 25% LW, 54% LY, 45% AVG |
| Corn Harvested | 7% TW vs. 5% LW, 9% LY, 8% AVG |
| Soybean Dropping Leaves | 42% TW vs. 22% LW, 55% LY, 47% AVG |
| Soybean Harvested | 3% TW vs. (NA)% LW, 5% LY, 5% AVG |
| Milo Coloring | 85% TW vs. 74% LW, 91% LY, 88% AVG |
| Milo Mature | 44% TW vs. 36% LW, 49% LY, 44% AVG |
| Milo Harvested | 24% TW vs. 23% LW, 24% LY, 26% AVG |
| Winter Wheat Planted | 21% TW vs. 10% LW, 20% LY, 17% AVG |
| Winter Wheat Emerged | 2% TW vs. (NA)% LW, 3% LY, 2% AVG |
| Spring Wheat Harvested | 94% TW vs. 85% LW, 100% LY, 94% AVG |
| Source: USDA/NASS |
Graphics courtesy of Advance Trading Inc.
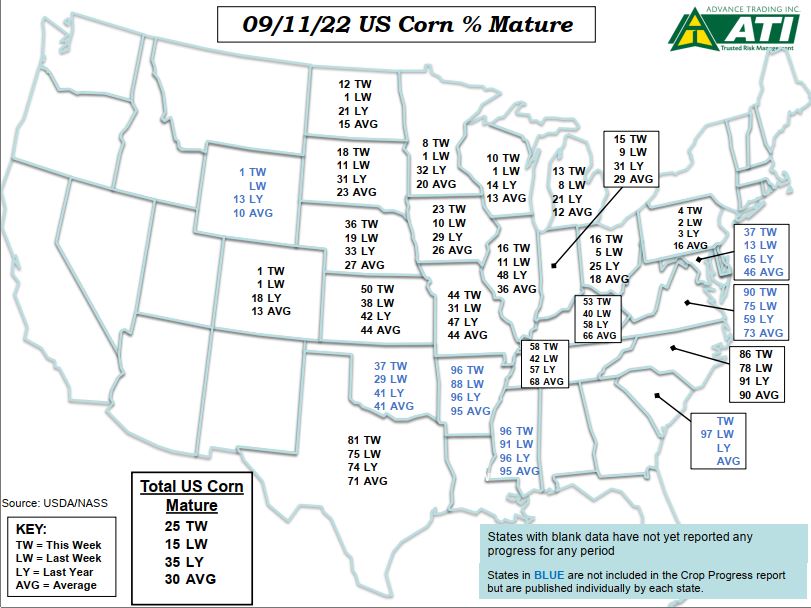
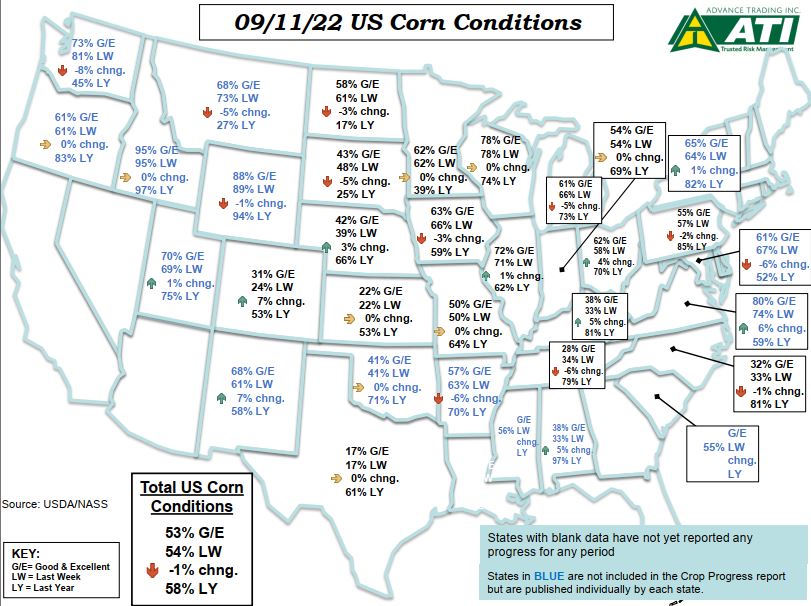
September 11th Crop Progress Report

| Conditions (Good + Excellent) | |
| Corn Conditions | G/E: 53% TW vs. 54% LW, 58% LY |
| Soybean Conditions | G/E: 56% TW vs. 57% LW, 57% LY |
| Milo Conditions | G/E: 20% TW vs. 21% LW, 57% LY |
| Crop Progress Summary | |
| Corn Dough | 95% TW vs. 92% LW, 95% LY, 96% AVG |
| Corn Dented | 77% TW vs. 63% LW, 85% LY, 79% AVG |
| Corn Mature | 25% TW vs. 15% LW, 35% LY, 30% AVG |
| Corn Harvested | 5% TW vs. (NA)% LW, 3% LY, 4% AVG |
| Soybean Setting Pods | 97% TW vs. 94% LW, 96% LY, 98% AVG |
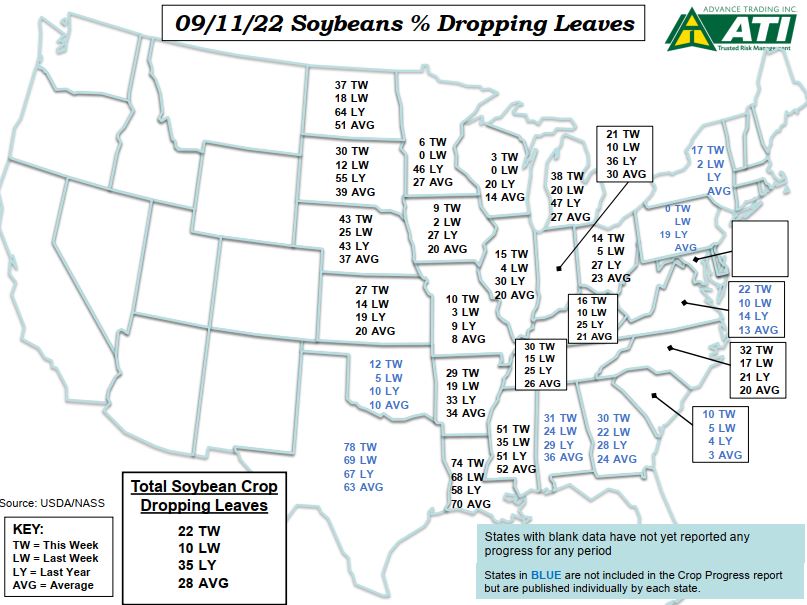
| Soybean Dropping Leaves | 22% TW vs. 10% LW, 35% LY, 28% AVG |
| Milo Headed | 96% TW vs. 92% LW, 99% LY, 99% AVG |
| Milo Coloring | 74% TW vs. 62% LW, 82% LY, 78% AVG |
| Milo Mature | 36% TW vs. 28% LW, 38% LY, 35% AVG |
| Milo Harvested | 23% TW vs. 20% LW, 21% LY, 23% AVG |
| Winter Wheat Planted | 10% TW vs. 3% LW, 11% LY, 7% AVG |
| Spring Wheat Harvested | 85% TW vs. 71% LW, 95% LY, 89% AVG |
| Source: USDA/NASS |
Read the complete NASS report here
Graphics courtesy of Advance Trading Inc
September 5th Crop Progress Report


| Conditions (Good + Excellent) | |
| Corn Conditions | G/E: 54% TW vs. 54% LW, 59% LY |
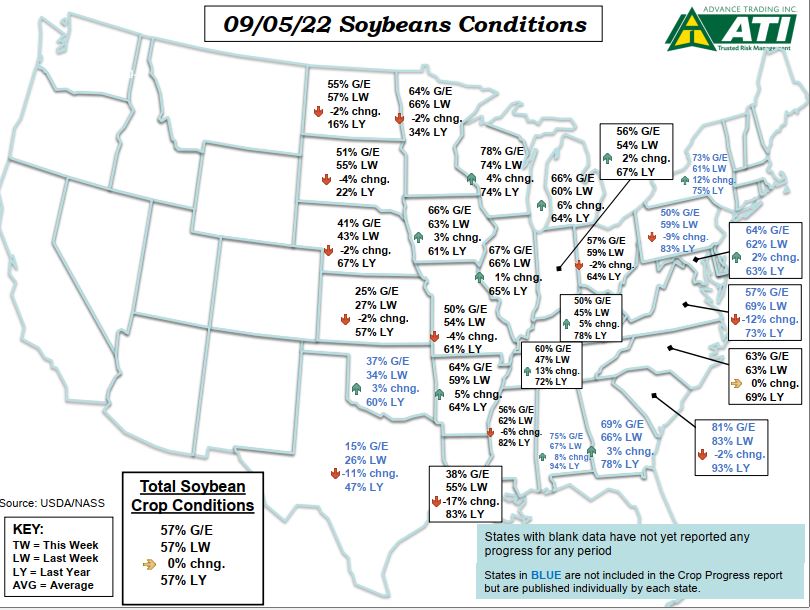
| Soybean Conditions | G/E: 57% TW vs. 57% LW, 57% LY |
| Milo Conditions | G/E: 21% TW vs. 21% LW, 57% LY |
| Crop Progress Summary | |
| Corn Dough | 92% TW vs. 86% LW, 94% LY, 93% AVG |
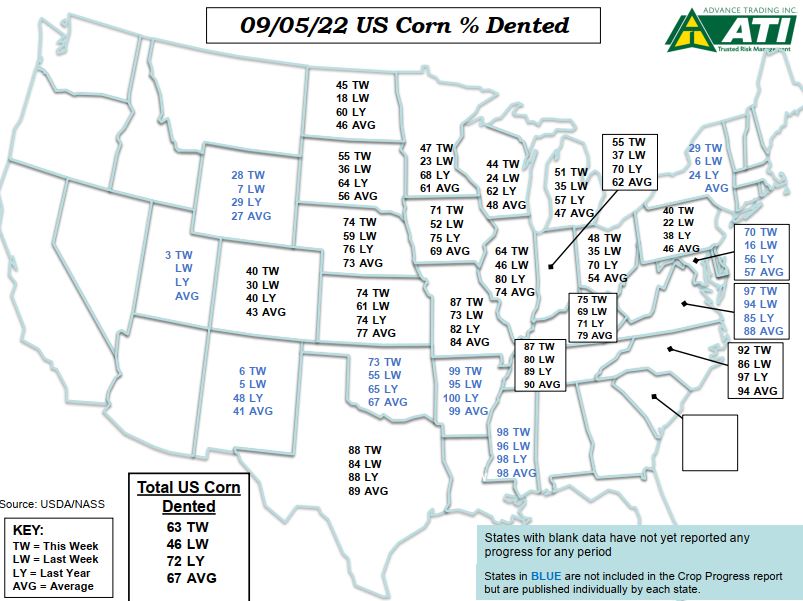
| Corn Dented | 63% TW vs. 46% LW, 72% LY, 67% AVG |
| Corn Mature | 15% TW vs. 8% LW, 19% LY, 18% AVG |
| Soybean Setting Pods | 94% TW vs. 91% LW, 96% LY, 96% AVG |
| Soybean Dropping Leaves | 10% TW vs. 4% LW, 17% LY, 14% AVG |
| Milo Headed | 92% TW vs. 88% LW, 98% LY, 97% AVG |
| Milo Coloring | 62% TW vs. 48% LW, 71% LY, 67% AVG |
| Milo Mature | 28% TW vs. 23% LW, 31% LY, 29% AVG |
| Milo Harvested | 20% TW vs. 18% LW, 19% LY, 21% AVG |
| Winter Wheat Planted | 3% TW vs. (NA)% LW, 5% LY, 3% AVG |
| Spring Wheat Harvested | 71% TW vs. 50% LW, 94% LY, 83% AVG |
| Source: USDA/NASS |
Graphics courtesy of Advance Trading Inc
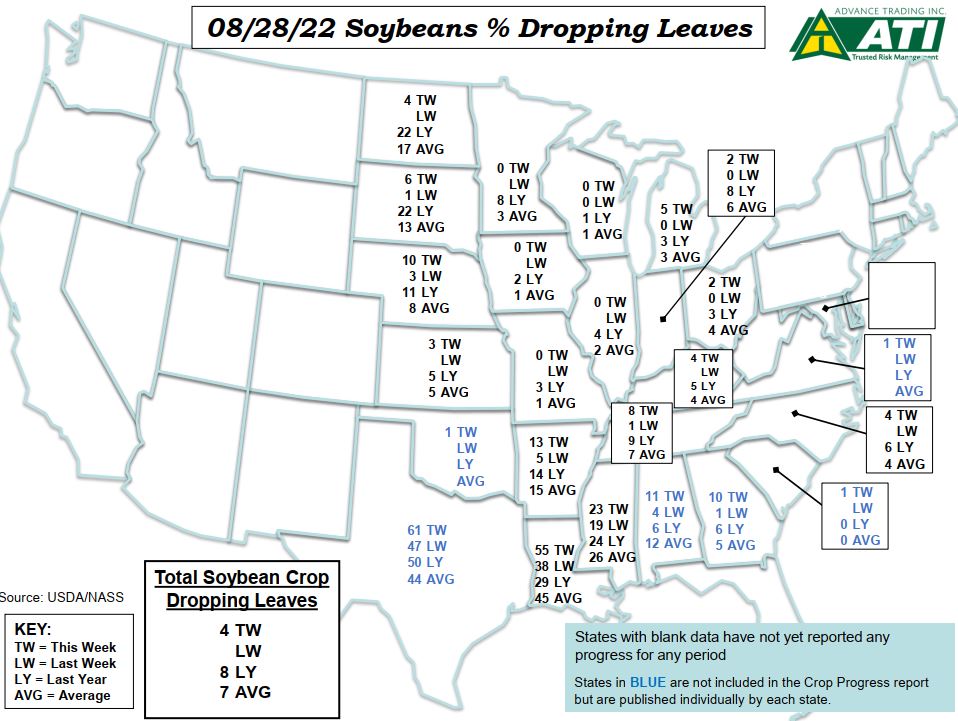
August 28th Crop Progress Report
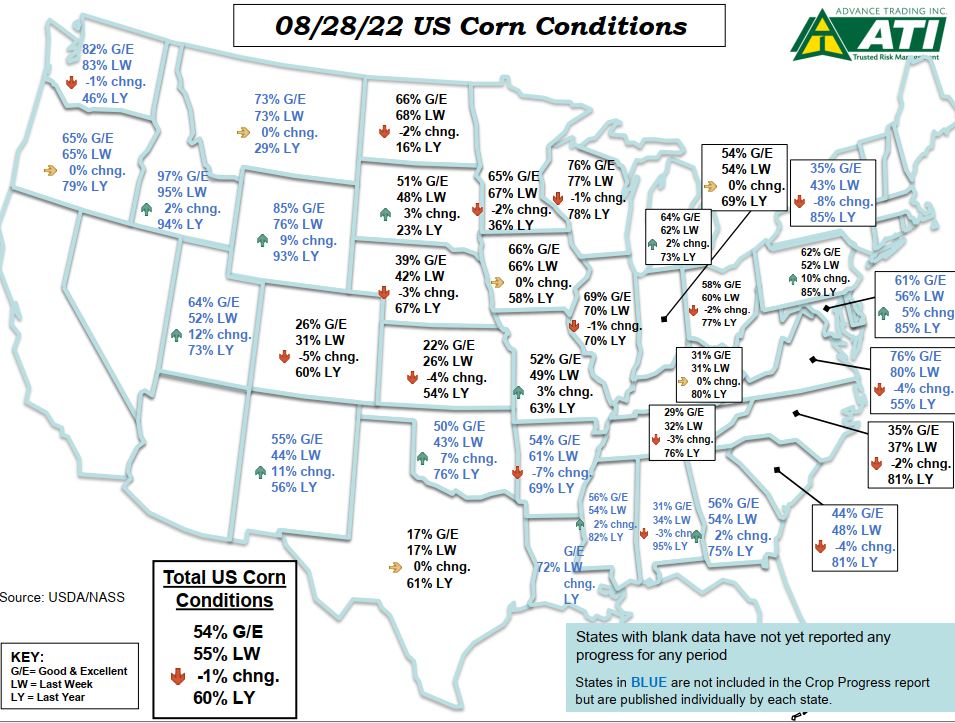

NASS reported corn condition scores dipped again in the most recent report. Corn conditions were rated 54% good-excellent vs. 55% last week and 60% last year. Soybean condition scores are reported steady at 57% good-excellent vs. the same for last week and 56% last year.
| Conditions (Good + Excellent) | |
| Corn Conditions | G/E: 54% TW vs. 55% LW, 60% LY |
| Soybean Conditions | G/E: 57% TW vs. 57% LW, 56% LY |
| Milo Conditions | G/E: 21% TW vs. 25% LW, 58% LY |
| Spring Wheat Conditions | G/E: 68% TW vs. 64% LW, 11% LY |
| Crop Progress Summary | |
| Corn Dough | 86% TW vs. 75% LW, 90% LY, 88% AVG |
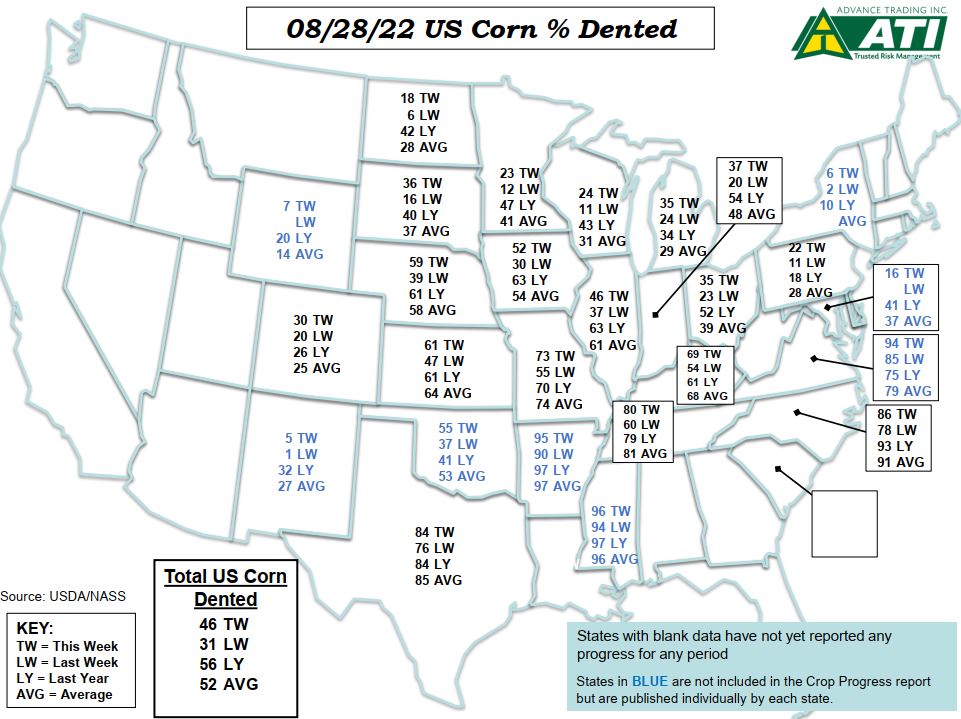
| Corn Dented | 46% TW vs. 31% LW, 56% LY, 52% AVG |
| Corn Mature | 8% TW vs. 4% LW, 8% LY, 9% AVG |
| Soybean Setting Pods | 91% TW vs. 84% LW, 92% LY, 92% AVG |
| Soybean Dropping Leaves | 4% TW vs. (NA)% LW, 8% LY, 7% AVG |
| Milo Headed | 88% TW vs. 79% LW, 94% LY, 93% AVG |
| Milo Coloring | 48% TW vs. 37% LW, 57% LY, 53% AVG |
| Milo Mature | 23% TW vs. 20% LW, 23% LY, 25% AVG |
| Milo Harvested | 18% TW vs. (NA)% LW, 18% LY, 20% AVG |
| Spring Wheat Harvested | 50% TW vs. 33% LW, 86% LY, 71% AVG |
| Source: USDA/NASS |
Read the complete NASS report here
Graphics courtesy of Advance Trading Inc.
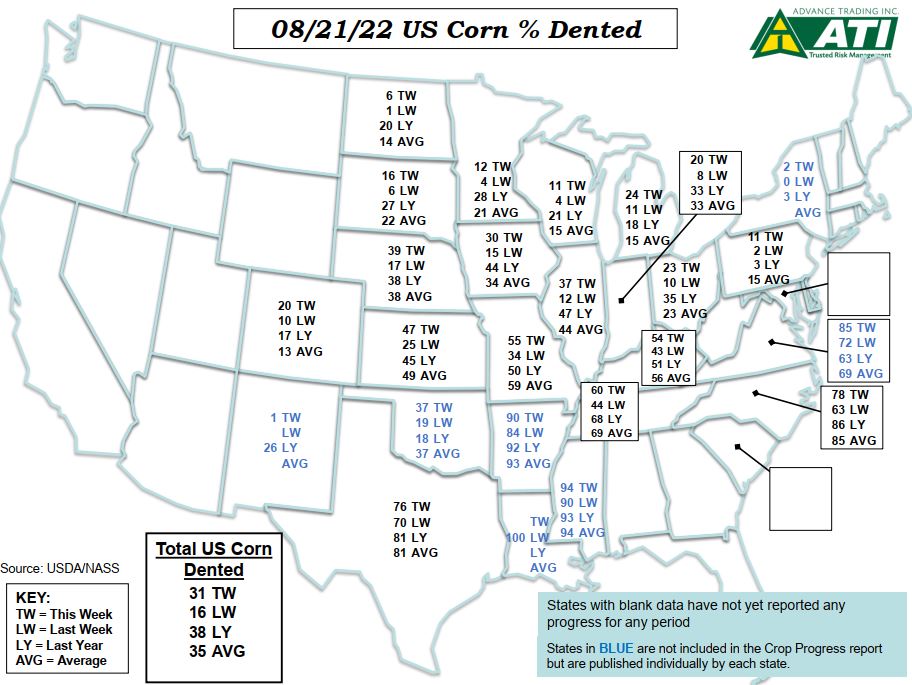
August 21st Crop Progress Report
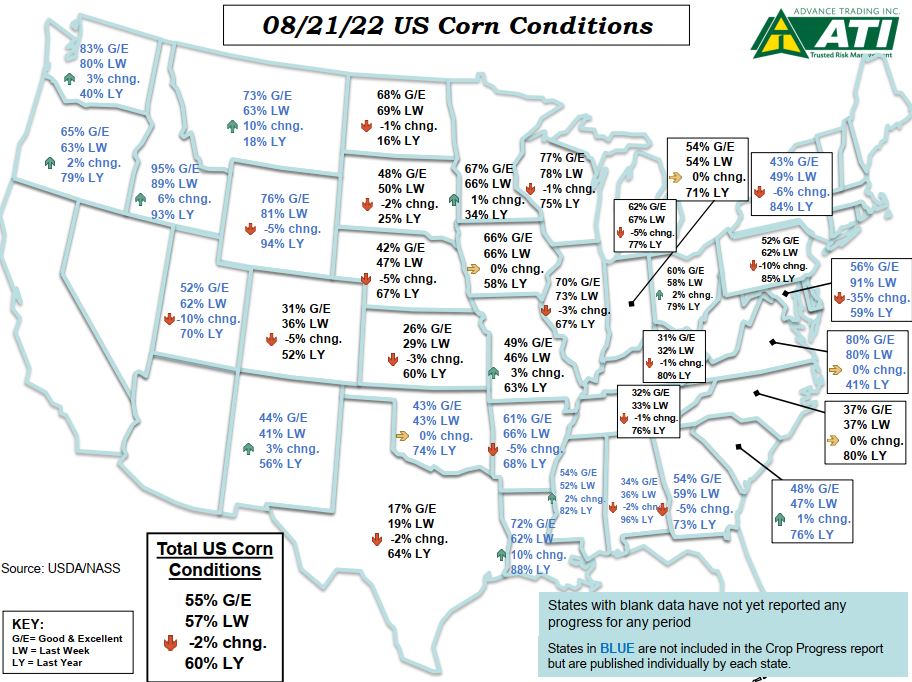
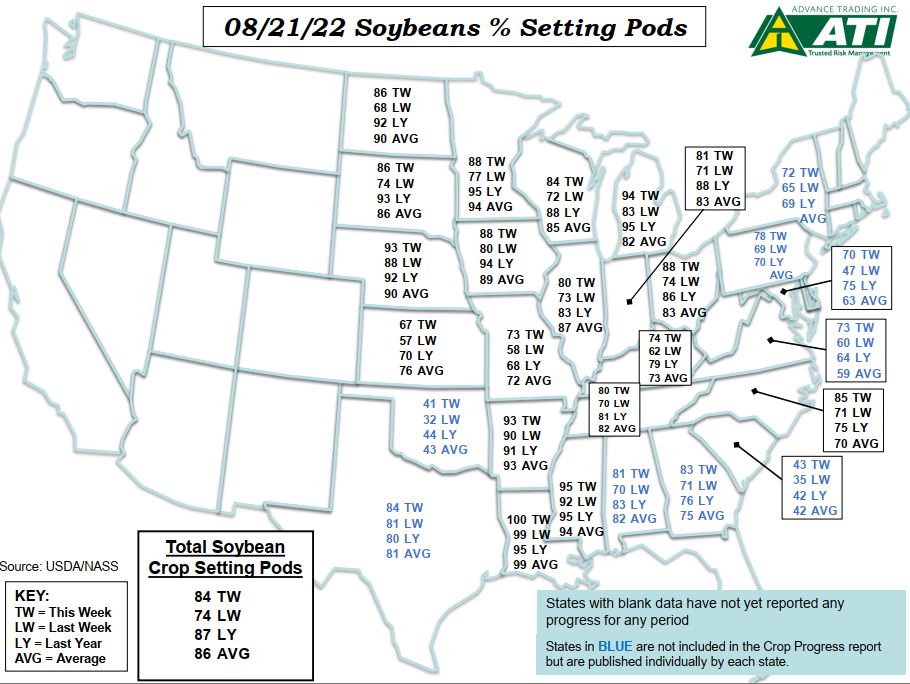

Corn and soybean conditions showed more deterioration in this week’s Crop Progress report from NASS.
Corn conditions dropped to 55% good-excellent vs. 57% last week and 60% last year. Soybean conditions slid to 57% good-excellent vs. 58% last week and 56% last year.
| Conditions (Good + Excellent) | |
| Corn Conditions | G/E: 55% TW vs. 57% LW, 60% LY |
| Soybean Conditions | G/E: 57% TW vs. 58% LW, 56% LY |
| Milo Conditions | G/E: 25% TW vs. 27% LW, 62% LY |
| Spring Wheat Conditions | G/E: 64% TW vs. 64% LW, 11% LY |
| Crop Progress Summary | |
| Corn Silking | 97% TW vs. 94% LW, 100% LY, 99% AVG |
| Corn Dough | 75% TW vs. 62% LW, 83% LY, 79% AVG |
| Corn Dented | 31% TW vs. 16% LW, 38% LY, 35% AVG |
| Corn Mature | 4% TW vs. (NA)% LW, 4% LY, 4% AVG |
| Soybean Blooming | 97% TW vs. 93% LW, 97% LY, 97% AVG |
| Soybean Setting Pods | 84% TW vs. 74% LW, 87% LY, 86% AVG |
| Milo Headed | 79% TW vs. 67% LW, 89% LY, 86% AVG |
| Milo Coloring | 37% TW vs. 30% LW, 42% LY, 42% AVG |
| Milo Mature | 20% TW vs. (NA)% LW, 20% LY, 22% AVG |
| Winter Wheat Harvested | 95% TW vs. 90% LW, 99% LY, 97% AVG |
| Spring Wheat Harvested | 33% TW vs. 16% LW, 74% LY, 54% AVG |
| Source: USDA/NASS |
Read the complete NASS report here
Graphics courtesy of Advance Trading Inc
August 14th Crop Progress Report
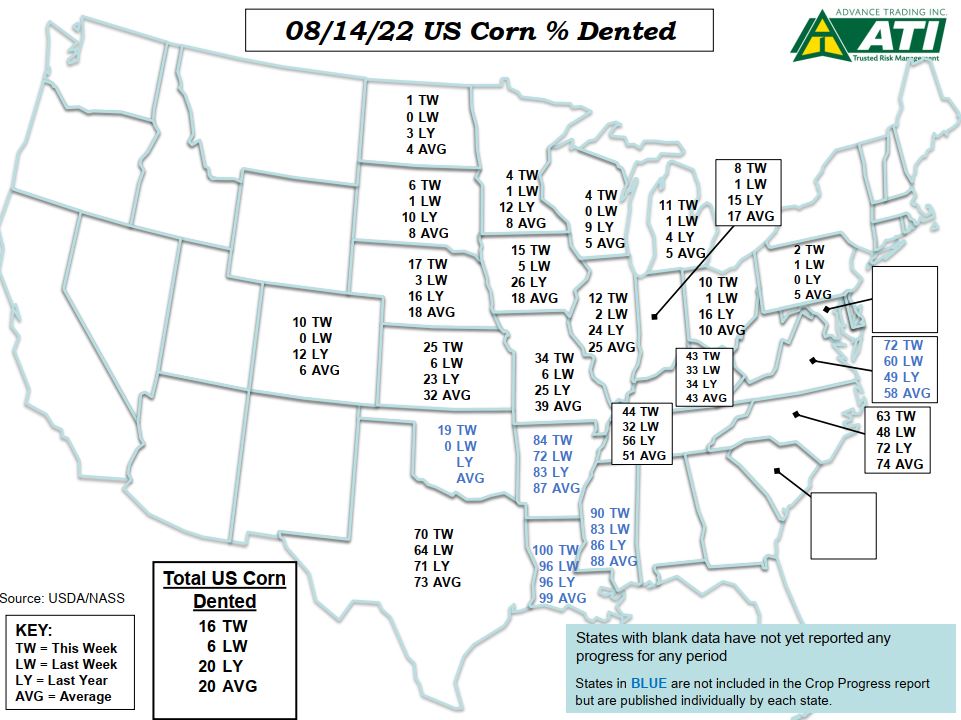
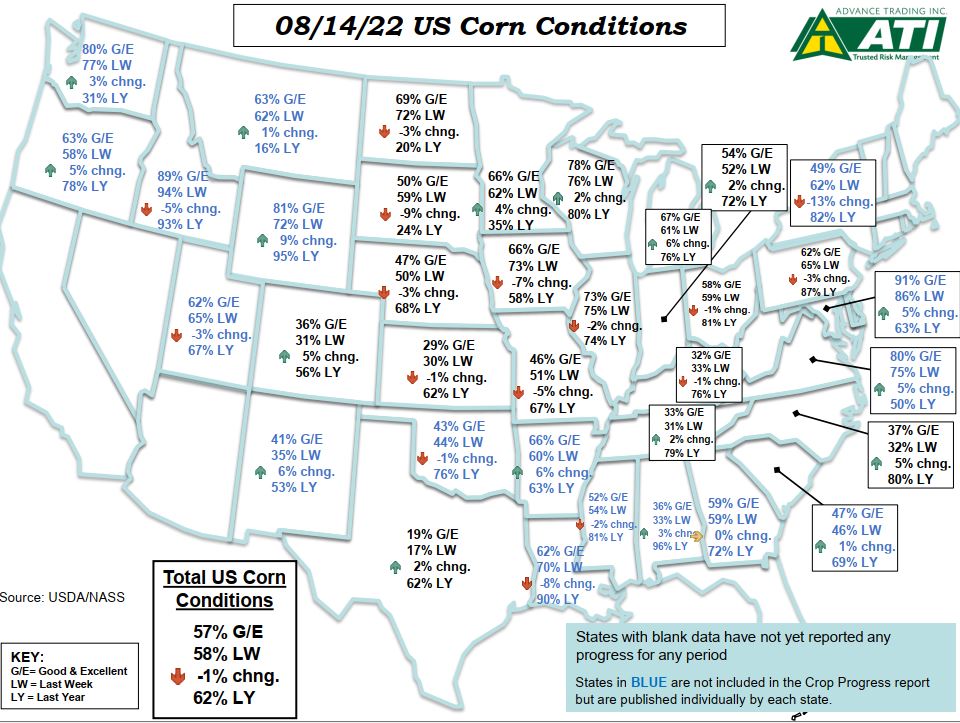
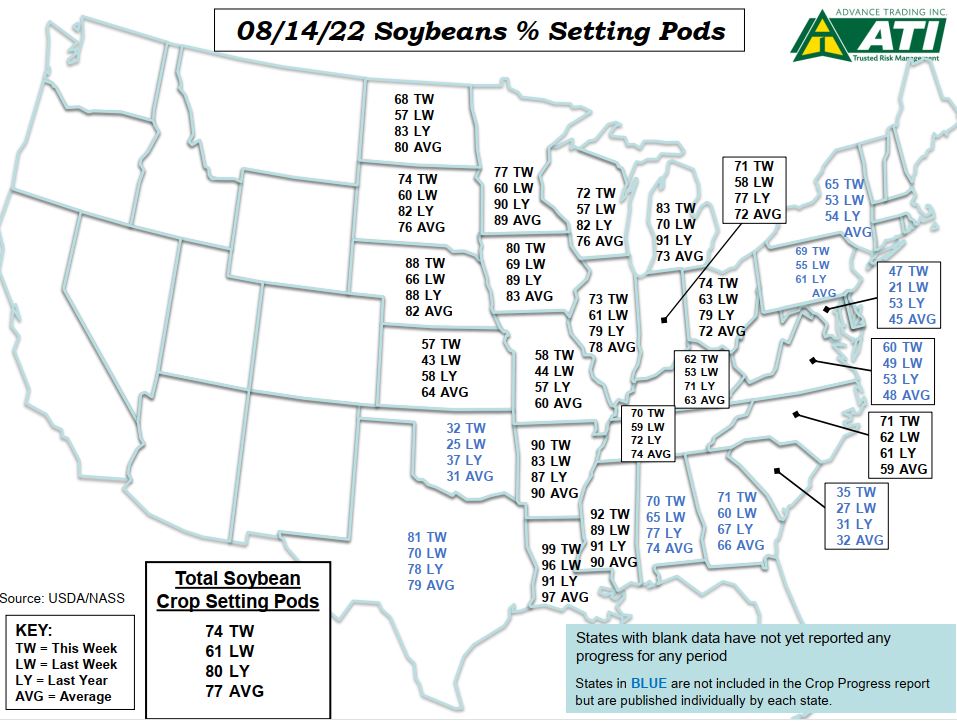
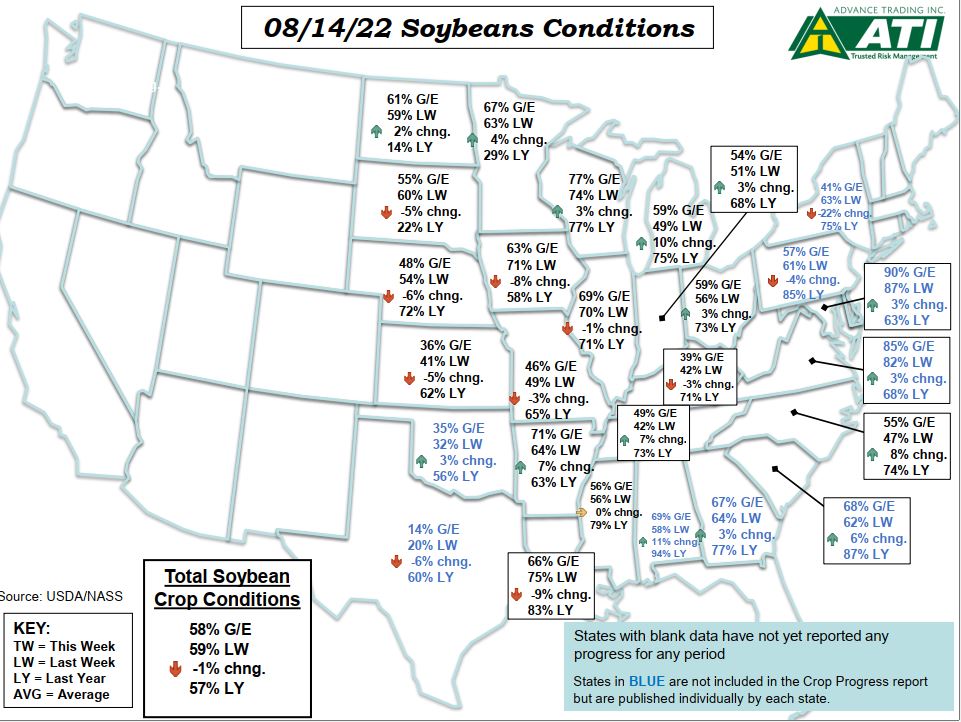
NASS reported that corn and soybean condition scores deteriorated once again nationally. Crop progress remains slightly behind the 5-year average.
Corn condition scores are reported 57% good-excellent vs. 58% last week and 62% last year. Soybean condition scores are reported 58% good-excellent vs. 59% last week and 57% last year.
| Conditions (Good + Excellent) | |
| Corn Conditions | G/E: 57% TW vs. 58% LW, 62% LY |
| Soybean Conditions | G/E: 58% TW vs. 59% LW, 57% LY |
| Milo Conditions | G/E: 27% TW vs. 29% LW, 60% LY |
| Spring Wheat Conditions | G/E: 64% TW vs. 64% LW, 11% LY |
| Crop Progress Summary | |
| Corn Silking | 94% TW vs. 90% LW, 98% LY, 97% AVG |
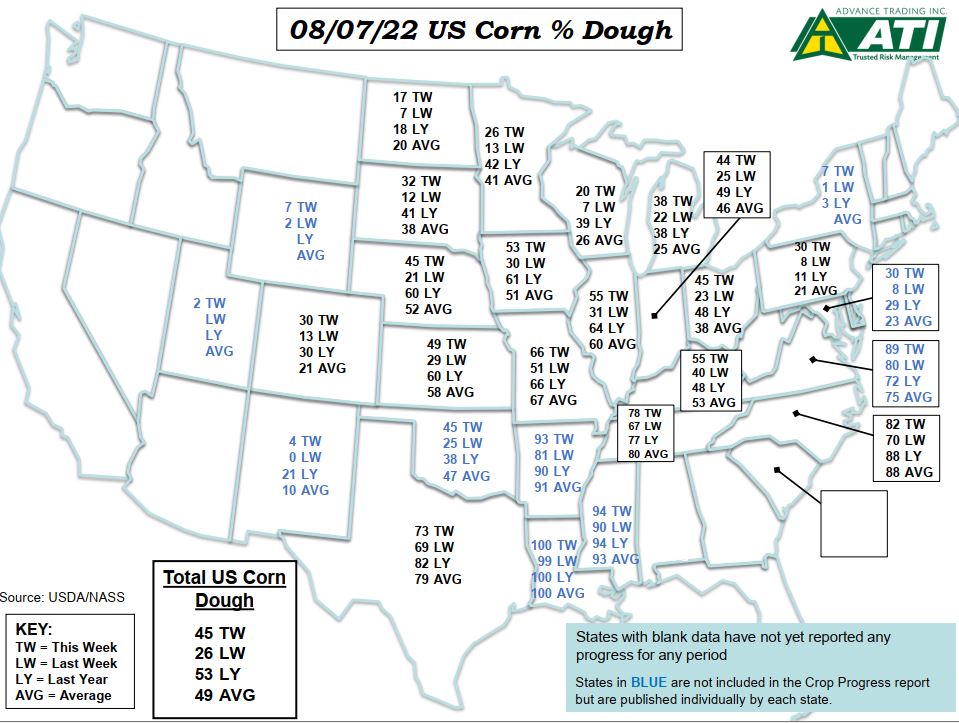
| Corn Dough | 62% TW vs. 45% LW, 71% LY, 65% AVG |
| Corn Dented | 16% TW vs. 6% LW, 20% LY, 20% AVG |
| Soybean Blooming | 93% TW vs. 89% LW, 94% LY, 93% AVG |
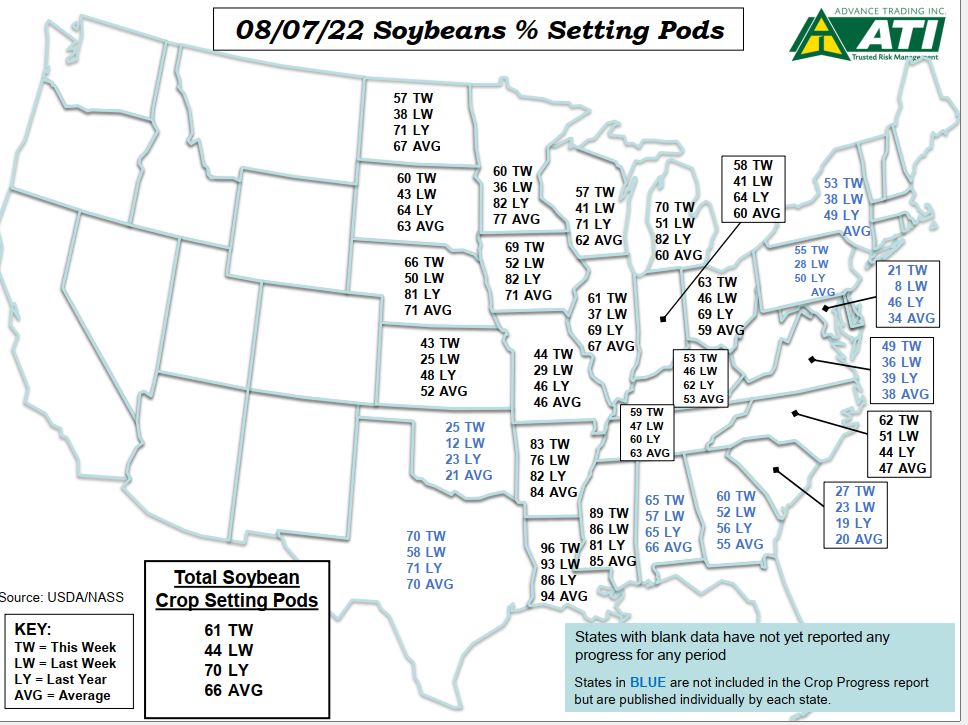
| Soybean Setting Pods | 74% TW vs. 61% LW, 80% LY, 77% AVG |
| Milo Headed | 67% TW vs. 55% LW, 80% LY, 77% AVG |
| Milo Coloring | 30% TW vs. 25% LW, 30% LY, 32% AVG |
| Winter Wheat Harvested | 90% TW vs. 86% LW, 97% LY, 94% AVG |
| Spring Wheat Harvested | 16% TW vs. 9% LW, 55% LY, 35% AVG |
| Source: USDA/NASS |
Read the complete NASS report here
Graphics courtesy of Advance Trading Inc

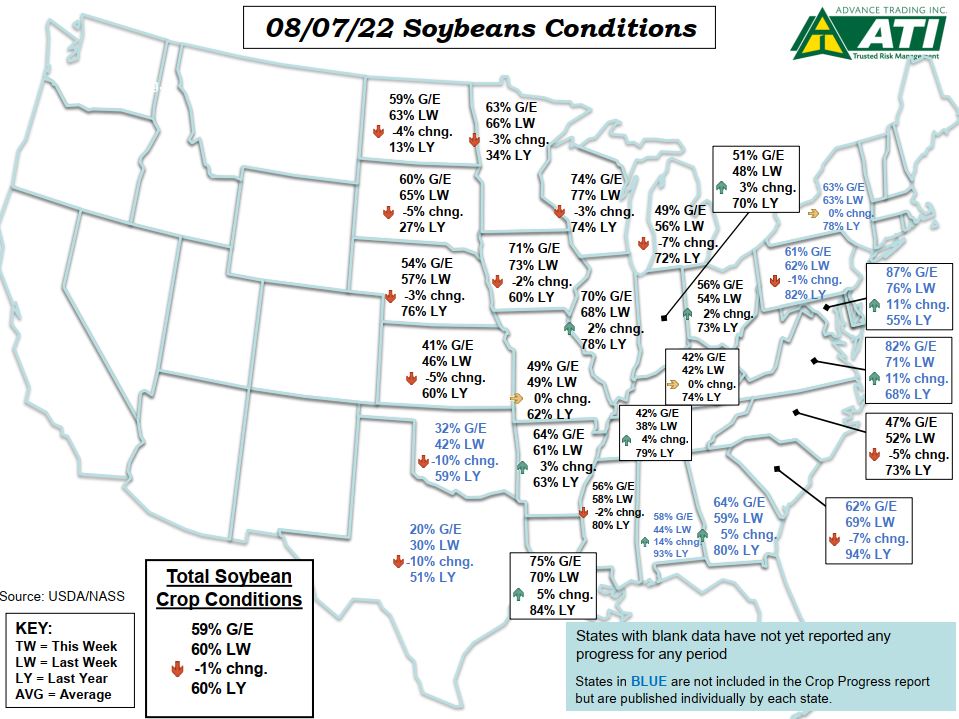
Crop condition scores showed the effects of hot and dry conditions over the past week as they slipped lower in the weekly report published by NASS.
Corn conditions deteriorated to 58% good-excellent vs. 61% last week and 64% last year Soybean conditions slipped to 59% good-excellent vs. 60% last week and 60% last year.
Progress continues at a pace slightly behind the 5-year average pace.
| Conditions (Good + Excellent) | |
| Corn Conditions | G/E: 58% TW vs. 61% LW, 64% LY |
| Soybean Conditions | G/E: 59% TW vs. 60% LW, 60% LY |
| Milo Conditions | G/E: 29% TW vs. 28% LW, 63% LY |
| Spring Wheat Conditions | G/E: 64% TW vs. 70% LW, 11% LY |
| Crop Progress Summary | |
| Corn Silking | 90% TW vs. 80% LW, 94% LY, 93% AVG |
| Corn Dough | 45% TW vs. 26% LW, 53% LY, 49% AVG |
| Corn Dented | 6% TW vs. (NA)% LW, 7% LY, 9% AVG |
| Soybean Blooming | 89% TW vs. 79% LW, 90% LY, 88% AVG |
| Soybean Setting Pods | 61% TW vs. 44% LW, 70% LY, 66% AVG |
| Milo Headed | 55% TW vs. 43% LW, 67% LY, 64% AVG |
| Milo Coloring | 25% TW vs. 21% LW, 25% LY, 27% AVG |
| Winter Wheat Harvested | 86% TW vs. 82% LW, 94% LY, 91% AVG |
| Spring Wheat Headed | 97% TW vs. 86% LW, 99% LY, 99% AVG |
| Source: USDA/NASS |
Read the complete NASS report here
Graphics courtesy of Advance Trading Inc


Graphics courtesy of Advance Trading Inc.
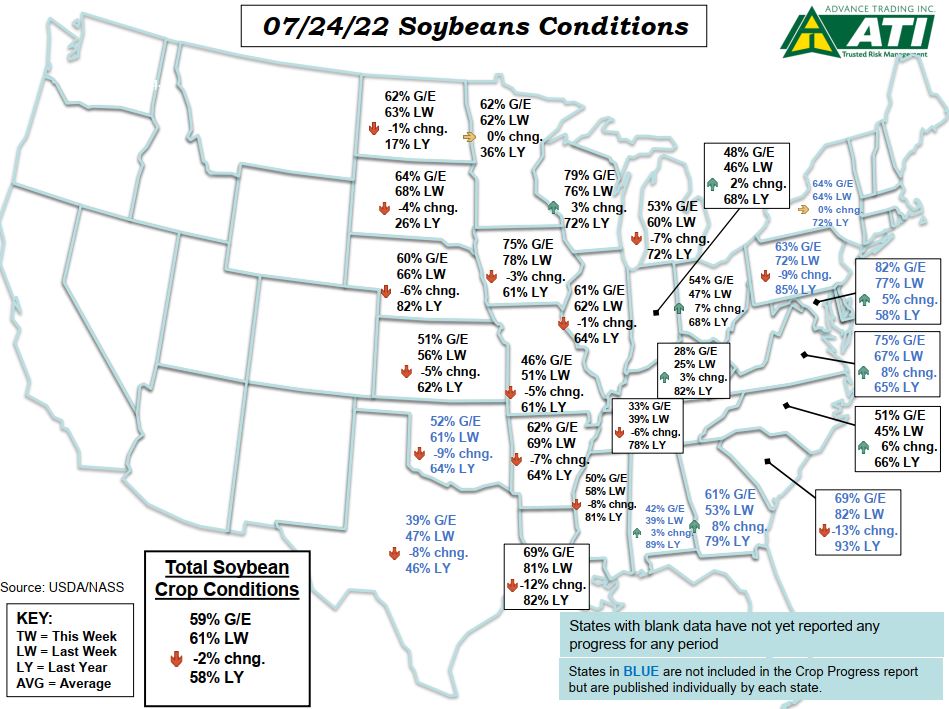
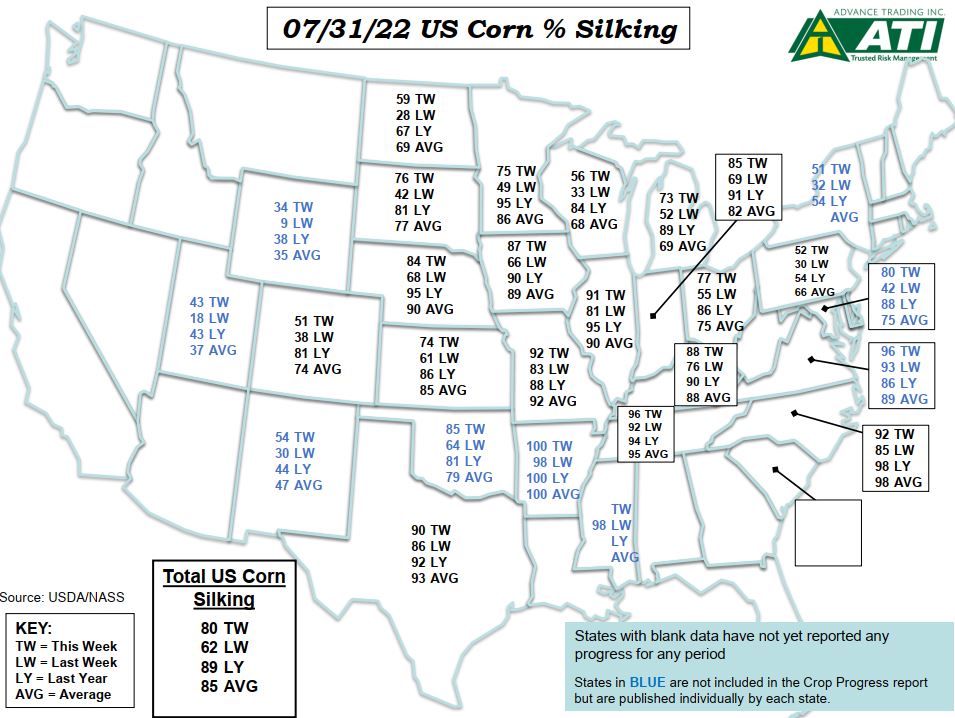
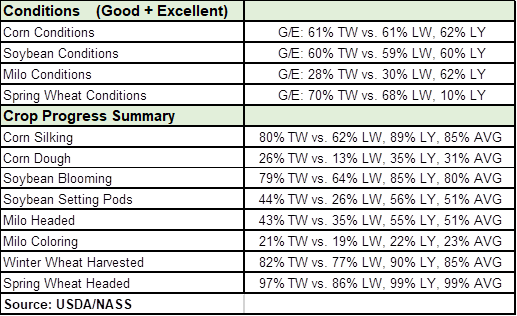
Crop condition scores declined this week and caught the market’s attention in the latest weekly report from NASS. Hot and dry conditions are taking a toll on crops as corn conditions dropped to 61% good-excellent vs. 64% last week and 64% last year. Soybean conditions also deteriorated as they declined to 59% good-excellent vs. 61% last week and 58% last year.
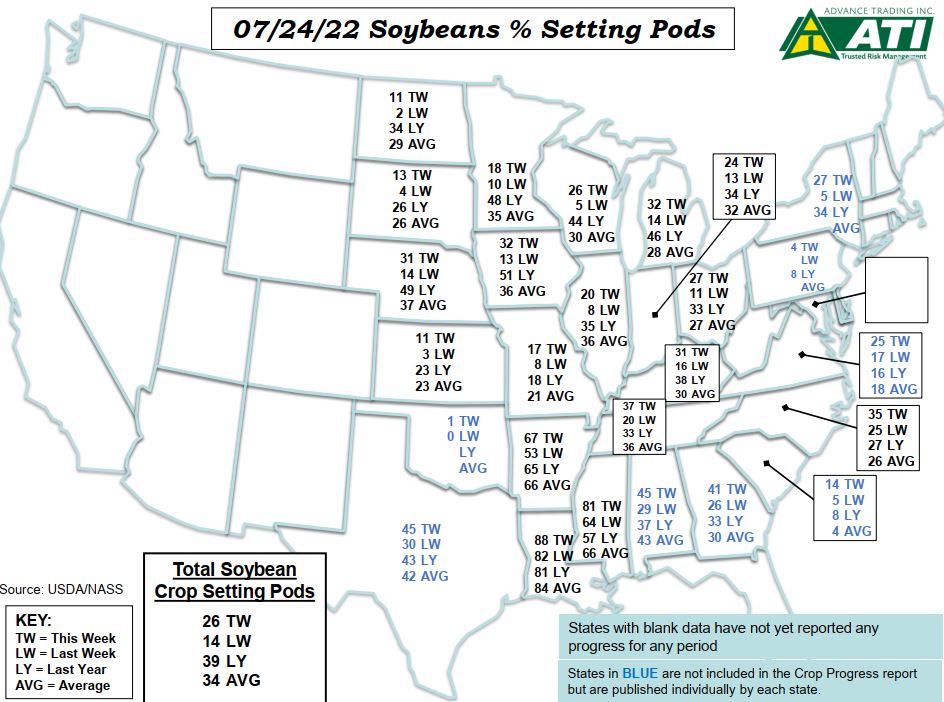
Progress is moving ahead slightly behind the 5-year average pace. Corn silking is at 62% vs. 76% last year and 70% on average. Soybeans setting pods are at 26% vs. 39% last year and 34% on average.
| Conditions (Good + Excellent) | |
| Corn Conditions | G/E: 61% TW vs. 64% LW, 64% LY |
| Soybean Conditions | G/E: 59% TW vs. 61% LW, 58% LY |
| Milo Conditions | G/E: 30% TW vs. 35% LW, 66% LY |
| Spring Wheat Conditions | G/E: 68% TW vs. 71% LW, 9% LY |
| Crop Progress Summary | |
| Corn Silking | 62% TW vs. 37% LW, 76% LY, 70% AVG |
| Corn Dough | 13% TW vs. 6% LW, 17% LY, 15% AVG |
| Soybean Blooming | 64% TW vs. 48% LW, 74% LY, 69% AVG |
| Soybean Setting Pods | 26% TW vs. 14% LW, 39% LY, 34% AVG |
| Milo Headed | 35% TW vs. 29% LW, 41% LY, 39% AVG |
| Milo Coloring | 19% TW vs. 17% LW, 20% LY, 20% AVG |
| Winter Wheat Harvested | 77% TW vs. 70% LW, 82% LY, 80% AVG |
| Spring Wheat Headed | 86% TW vs. 68% LW, 96% LY, 96% AVG |
| Source: USDA/NASS |
Read the complete NASS report here
Graphics courtesy of Advance Trading Inc.


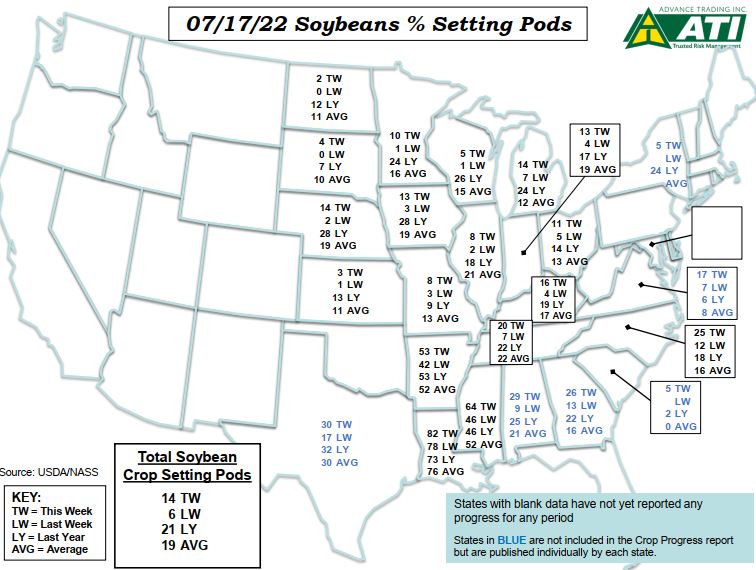
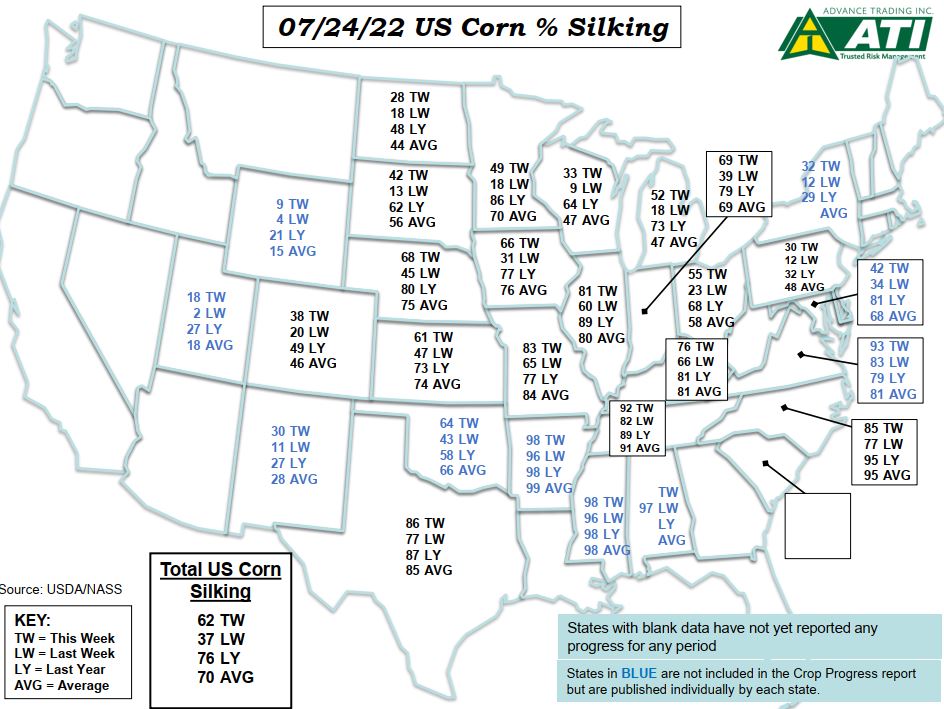
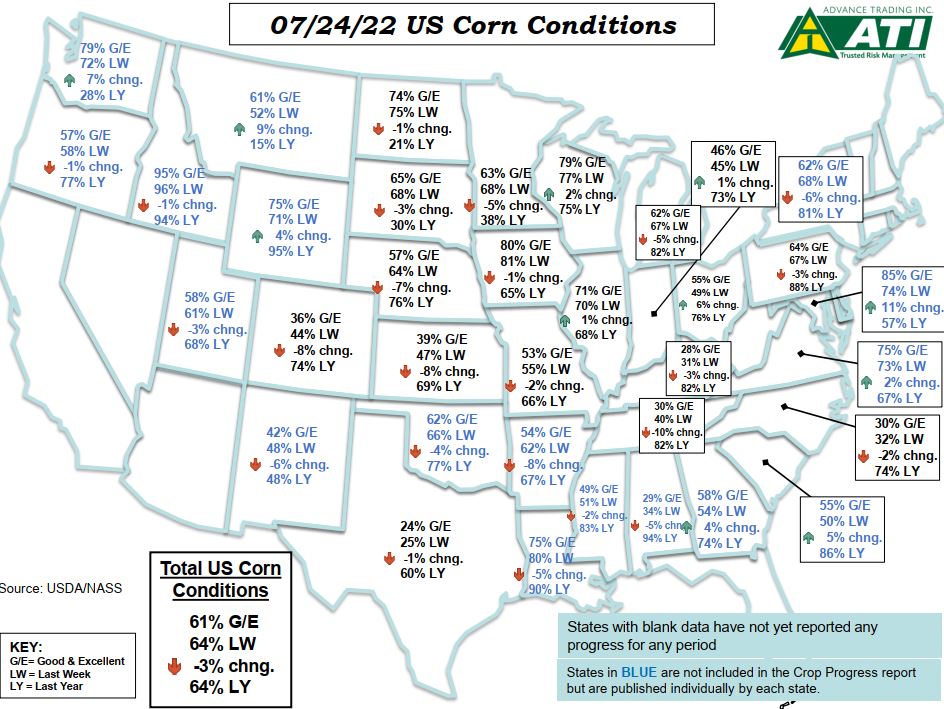
NASS reports that corn and soybean crop progress is running a little behind last year and the 5-year average progress. Corn silking is 37% as of Sunday vs. 52% last year and 48% on average. Soybeans setting pods are at 14% vs. 21% last year and 19% on average.
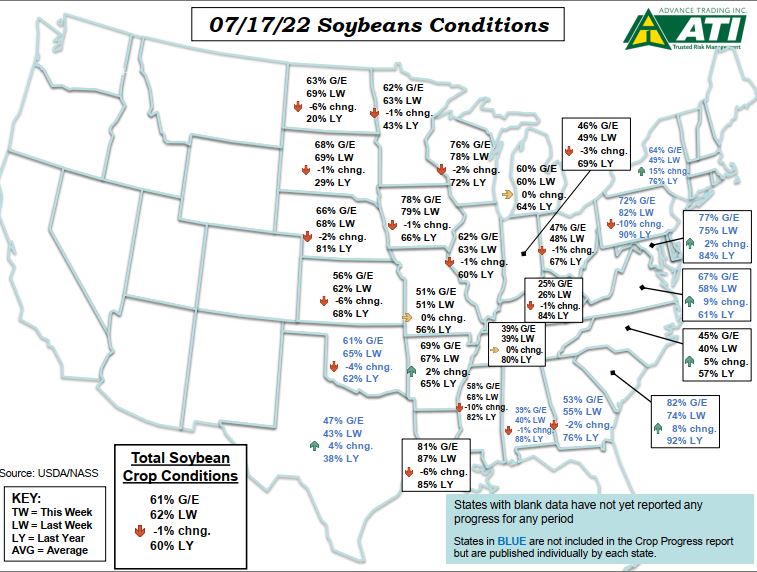
Corn condition scores were steady again this week at 64% good-excellent vs. 65% last year while soybean condition scores slipped again to 61% good-excellent vs. 62% last week and 60% last year.
| Conditions (Good + Excellent) | |
| Corn Conditions | G/E: 64% TW vs. 64% LW, 65% LY |
| Soybean Conditions | G/E: 61% TW vs. 62% LW, 60% LY |
| Milo Conditions | G/E: 35% TW vs. 40% LW, 68% LY |
| Spring Wheat Conditions | G/E: 71% TW vs. 70% LW, 11% LY |
| Crop Progress Summary | |
| Corn Silking | 37% TW vs. 15% LW, 52% LY, 48% AVG |
| Corn Dough | 6% TW vs. 2% LW, 7% LY, 7% AVG |
| Soybean Blooming | 48% TW vs. 32% LW, 61% LY, 55% AVG |
| Soybean Setting Pods | 14% TW vs. 6% LW, 21% LY, 19% AVG |
| Milo Headed | 29% TW vs. 24% LW, 32% LY, 31% AVG |
| Milo Coloring | 17% TW vs. 15% LW, 17% LY, 18% AVG |
| Winter Wheat Harvested | 70% TW vs. 63% LW, 71% LY, 71% AVG |
| Spring Wheat Headed | 68% TW vs. 44% LW, 91% LY, 90% AVG |
| Source: USDA/NASS |
Read the complete NASS report here
Graphics courtesy of Advance Trading Inc


NASS reported national corn ratings held steady overall for the week ending July 10th at 64% good-excellent which was the same last week and 65% a year ago. Soybean condition scores slipped again to 62% good-excellent vs. 63% last week and 59% last year.
| Conditions (Good + Excellent) | |
| Corn Conditions | G/E: 64% TW vs. 64% LW, 65% LY |
| Soybean Conditions | G/E: 62% TW vs. 63% LW, 59% LY |
| Milo Conditions | G/E: 40% TW vs. 42% LW, 70% LY |
| Spring Wheat Conditions | G/E: 70% TW vs. 66% LW, 16% LY |
| Crop Progress Summary | |
| Corn Silking | 15% TW vs. 7% LW, 24% LY, 25% AVG |
| Corn Dough | 2% TW vs. (NA)% LW, 3% LY, 3% AVG |
| Soybean Blooming | 32% TW vs. 16% LW, 44% LY, 38% AVG |
| Soybean Setting Pods | 6% TW vs. 3% LW, 9% LY, 9% AVG |
| Milo Headed | 24% TW vs. 21% LW, 28% LY, 26% AVG |
| Milo Coloring | 15% TW vs. 14% LW, 15% LY, 16% AVG |
| Winter Wheat Harvested | 63% TW vs. 54% LW, 57% LY, 61% AVG |
| Spring Wheat Headed | 44% TW vs. 20% LW, 81% LY, 77% AVG |
| Source: USDA/NASS |
Read the complete NASS report here
Graphics courtesy of Advance Trading Inc.

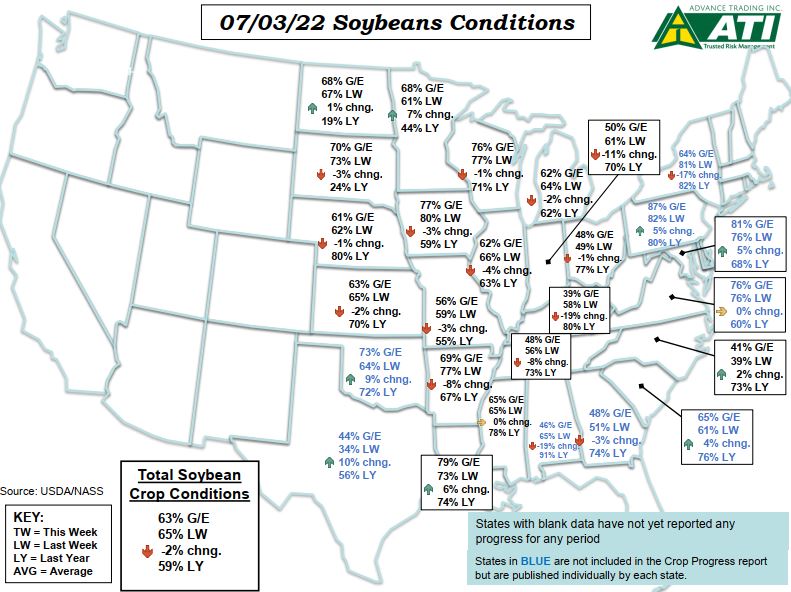
Crop conditions slipped once again in this week’s NASS report. Corn condition scores declined to 64% good-excellent vs. 67% last week and 64% last year. Soybean conditions declined to 63% good-excellent vs. 65% last week and 59% last year.
Corn silking is at 7% vs. 9% last year and 11% on average.
| Conditions (Good + Excellent) | |
| Corn Conditions | G/E: 64% TW vs. 67% LW, 64% LY |
| Soybean Conditions | G/E: 63% TW vs. 65% LW, 59% LY |
| Milo Conditions | G/E: 42% TW vs. 43% LW, 72% LY |
| Winter Wheat Conditions | G/E: 31% TW vs. 30% LW, 47% LY |
| Spring Wheat Conditions | G/E: 66% TW vs. 59% LW, 16% LY |
| Crop Progress Summary | |
| Corn Silking | 7% TW vs. 4% LW, 9% LY, 11% AVG |
| Soybean Emerged | 96% TW vs. 91% LW, 98% LY, 96% AVG |
| Soybean Blooming | 16% TW vs. 7% LW, 27% LY, 22% AVG |
| Soybean Setting Pods | 3% TW vs. (NA)% LW, 3% LY, 3% AVG |
| Milo Planted | 97% TW vs. 90% LW, 97% LY, 98% AVG |
| Milo Headed | 21% TW vs. 19% LW, 22% LY, 23% AVG |
| Milo Coloring | 14% TW vs. (NA)% LW, 13% LY, 13% AVG |
| Winter Wheat Harvested | 54% TW vs. 41% LW, 43% LY, 48% AVG |
| Spring Wheat Headed | 20% TW vs. 8% LW, 66% LY, 57% AVG |
| Source: USDA/NASS |
Read the complete NASS report here
Graphics courtesy of Advance Trading Inc.
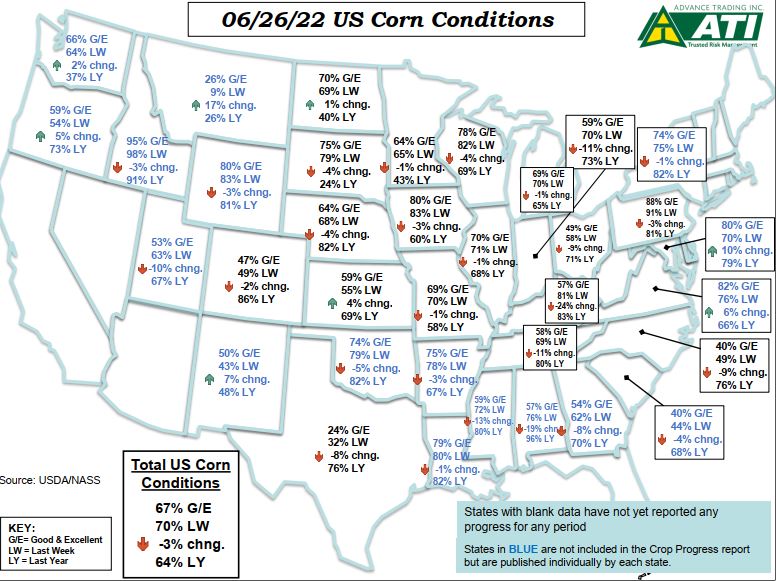

Corn and soybean crop condition scores each slipped 3% out of the good-excellent categories in the most recent weekly crop report from NASS.
Corn condition scores dropped to 67% good-excellent vs. 70% last week and 64% last year. Soybean condition scores dropped to 65% good-excellent vs. 68% last week and 60% last year.
| Conditions (Good + Excellent) | |
| Corn Conditions | G/E: 67% TW vs. 70% LW, 64% LY |
| Soybean Conditions | G/E: 65% TW vs. 68% LW, 60% LY |
| Milo Conditions | G/E: 43% TW vs. 46% LW, 70% LY |
| Winter Wheat Conditions | G/E: 30% TW vs. 30% LW, 48% LY |
| Spring Wheat Conditions | G/E: 59% TW vs. 59% LW, 20% LY |
| Crop Progress Summary | |
| Corn Silking | 4% TW vs. (NA)% LW, 4% LY, 4% AVG |
| Soybean Planted | 98% TW vs. 94% LW, 99% LY, 97% AVG |
| Soybean Emerged | 91% TW vs. 83% LW, 95% LY, 91% AVG |
| Soybean Blooming | 7% TW vs. (NA)% LW, 13% LY, 11% AVG |
| Milo Planted | 90% TW vs. 80% LW, 94% LY, 94% AVG |
| Milo Headed | 19% TW vs. 15% LW, 19% LY, 20% AVG |
| Winter Wheat Headed | 95% TW vs. 91% LW, 98% LY, 98% AVG |
| Winter Wheat Harvested | 41% TW vs. 25% LW, 31% LY, 35% AVG |
| Spring Wheat Emerged | 98% TW vs. 89% LW, 100% LY, 99% AVG |
| Spring Wheat Headed | 8% TW vs. (NA)% LW, 45% LY, 34% AVG |
| Source: USDA/NASS |
Read the complete NASS report here
Graphics courtesy of Advance Trading Inc.
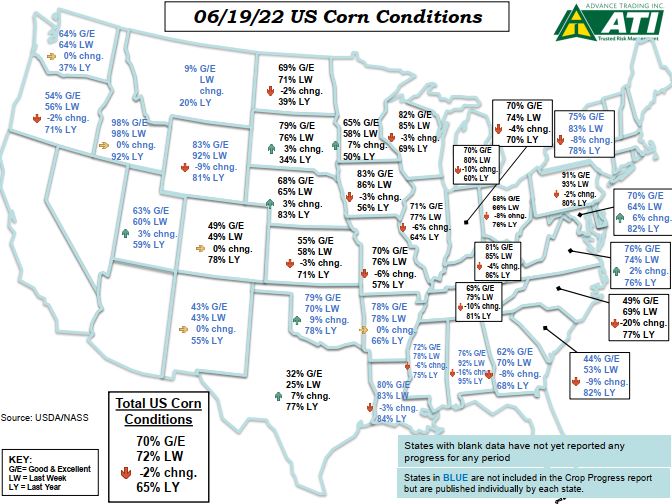
| Conditions (Good + Excellent) | |
| Corn Conditions | G/E: 70% TW vs. 72% LW, 65% LY |
| Soybean Conditions | G/E: 68% TW vs. 70% LW, 60% LY |
| Milo Conditions | G/E: 46% TW vs. 47% LW, 73% LY |
| Winter Wheat Conditions | G/E: 30% TW vs. 31% LW, 49% LY |
| Spring Wheat Conditions | G/E: 59% TW vs. 54% LW, 27% LY |
| Crop Progress Summary | |
| Corn Emerged | 95% TW vs. 88% LW, 99% LY, 95% AVG |
| Soybean Planted | 94% TW vs. 88% LW, 97% LY, 93% AVG |
| Soybean Emerged | 83% TW vs. 70% LW, 90% LY, 84% AVG |
| Milo Planted | 80% TW vs. 66% LW, 86% LY, 85% AVG |
| Milo Headed | 15% TW vs. 13% LW, 16% LY, 17% AVG |
| Winter Wheat Headed | 91% TW vs. 86% LW, 95% LY, 95% AVG |
| Winter Wheat Harvested | 25% TW vs. 10% LW, 15% LY, 22% AVG |
| Spring Wheat Planted | 98% TW vs. 94% LW, 100% LY, 100% AVG |
| Spring Wheat Emerged | 89% TW vs. 72% LW, 98% LY, 97% AVG |
| Source: USDA/NASS |
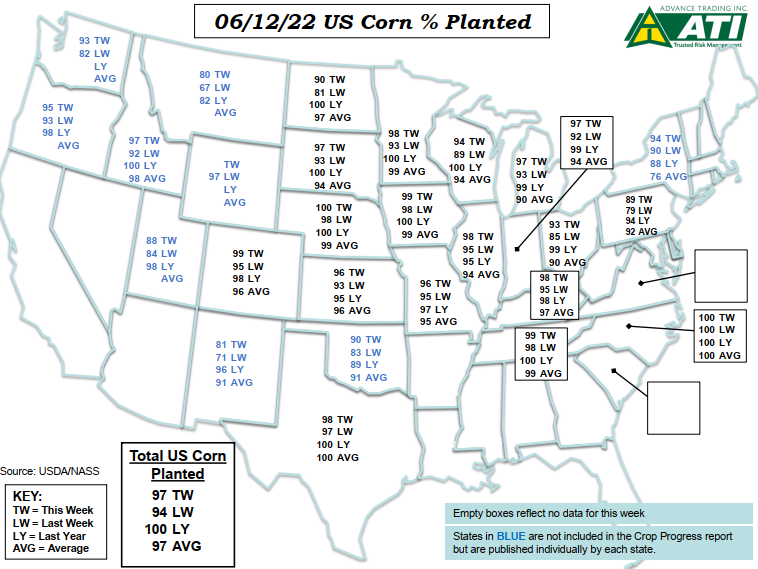
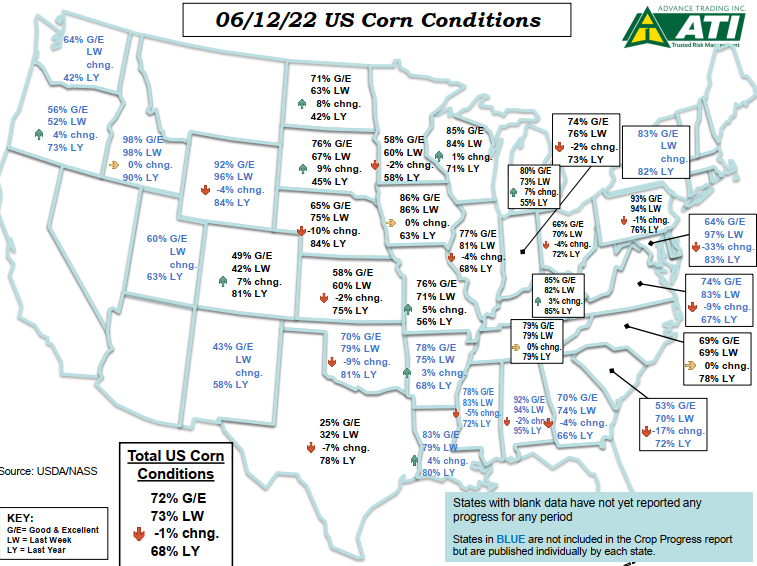
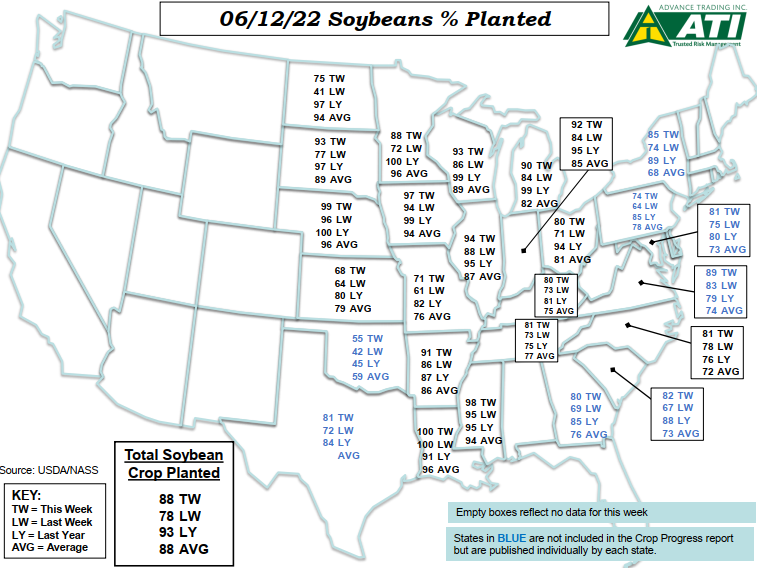
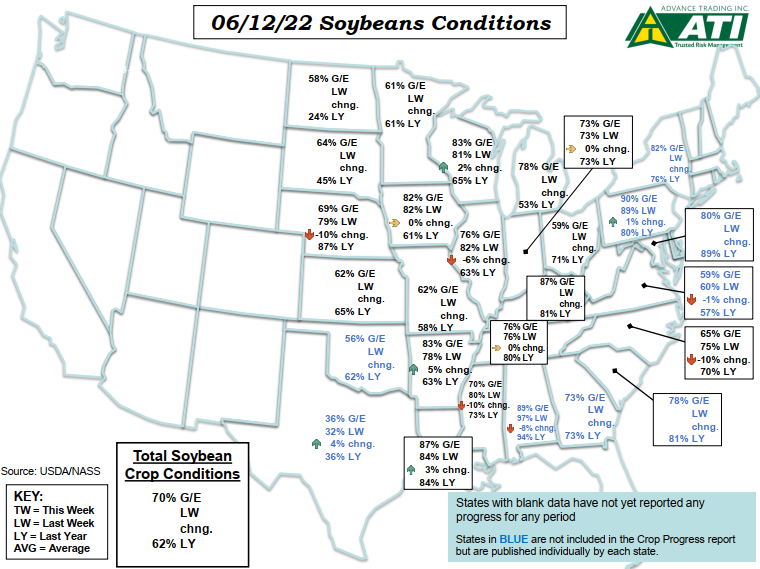
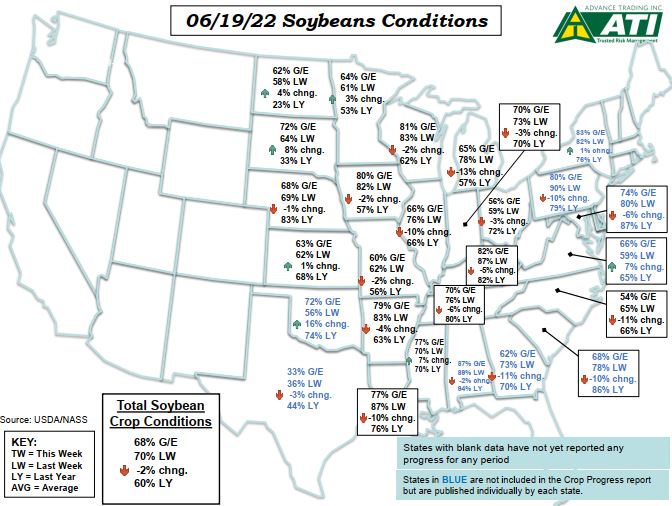
Like the initial corn condition scores of the year released last week, the first soybean condition scores of the year look good overall. Soybean conditions were reported 70% good-excellent vs. 62% last year. Corn conditions slipped to 72% good-excellent vs. 73% last week and 68% last year.
Corn planting is 97% complete vs. 100% last year and 97% on average. Soybean planting is 88% complete vs. 95% last year and 89% on average.
| Conditions (Good + Excellent) | |
| Corn Conditions | G/E: 72% TW vs. 73% LW, 68% LY |
| Soybean Conditions | G/E: 70% TW vs. NA LW, 62% LY |
| Milo Conditions | G/E: 47% TW vs. 46% LW, 74% LY |
| Winter Wheat Conditions | G/E: 31% TW vs. 30% LW, 48% LY |
| Spring Wheat Conditions | G/E: 54% TW vs. NA LW, 37% LY |
| Crop Progress Summary | |
| Corn Planted | 97% TW vs. 94% LW, 100% LY, 97% AVG |
| Corn Emerged | 88% TW vs. 78% LW, 95% LY, 89% AVG |
| Soybean Planted | 88% TW vs. 78% LW, 93% LY, 88% AVG |
| Soybean Emerged | 70% TW vs. 56% LW, 85% LY, 74% AVG |
| Milo Planted | 66% TW vs. 56% LW, 69% LY, 71% AVG |
| Milo Headed | 13% TW vs. (NA)% LW, 13% LY, 15% AVG |
| Winter Wheat Headed | 86% TW vs. 79% LW, 91% LY, 90% AVG |
| Winter Wheat Harvested | 10% TW vs. 5% LW, 4% LY, 12% AVG |
| Spring Wheat Planted | 94% TW vs. 82% LW, 100% LY, 99% AVG |
| Spring Wheat Emerged | 72% TW vs. 55% LW, 95% LY, 93% AVG |
| Source: USDA/NASS |
Read the complete NASS report here
Graphics courtesy of Advance Trading Inc.
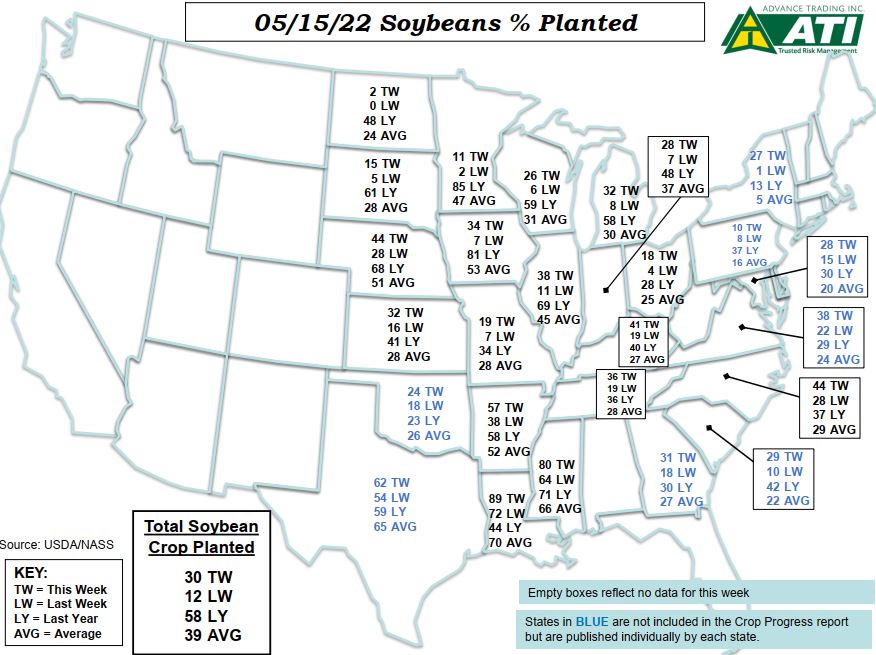
Corn and soybean planting progress has caught up to the 5-year average progress across the country. NASS reported corn planting is 94% complete vs. 98% last year and 92% on average. Soybean planting is 78% complete vs. 89% last year and 79% on average. Planting and emergence is still behind average in some areas and most notably North Dakota.
This week brought the first national corn crop condition scores of the year. Conditions are good overall 73% good -excellent vs. 72% last year at this time.
| Conditions (Good + Excellent) | |
| Corn Conditions | G/E: 73% TW vs. NA LW, 72% LY |
| Milo Conditions | G/E: 46% TW vs. (NA)% LW, 74% LY |
| Winter Wheat Conditions | G/E: 30% TW vs. 29% LW, 50% LY |
| Crop Progress Summary | |
| Corn Planted | 94% TW vs. 86% LW, 98% LY, 92% AVG |
| Corn Emerged | 78% TW vs. 61% LW, 89% LY, 81% AVG |
| Soybean Planted | 78% TW vs. 66% LW, 89% LY, 79% AVG |
| Soybean Emerged | 56% TW vs. 39% LW, 74% LY, 59% AVG |
| Milo Planted | 56% TW vs. 40% LW, 50% LY, 55% AVG |
| Winter Wheat Headed | 79% TW vs. 72% LW, 84% LY, 84% AVG |
| Winter Wheat Harvested | 5% TW vs. (NA)% LW, 2% LY, 6% AVG |
| Spring Wheat Planted | 82% TW vs. 73% LW, 99% LY, 97% AVG |
| Spring Wheat Emerged | 55% TW vs. 42% LW, 89% LY, 83% AVG |
| Source: USDA/NASS |
Read the complete NASS report here
Graphics courtesy of Advance Trading Inc
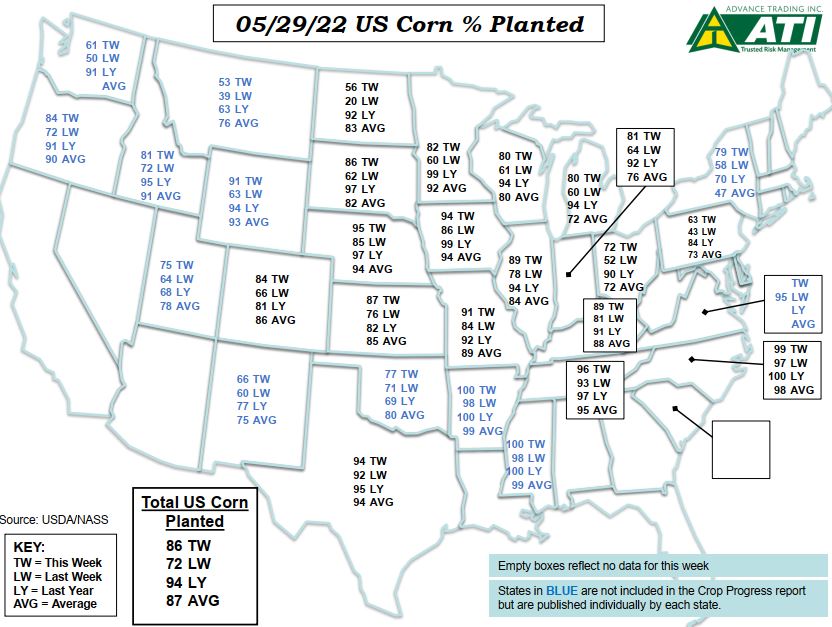
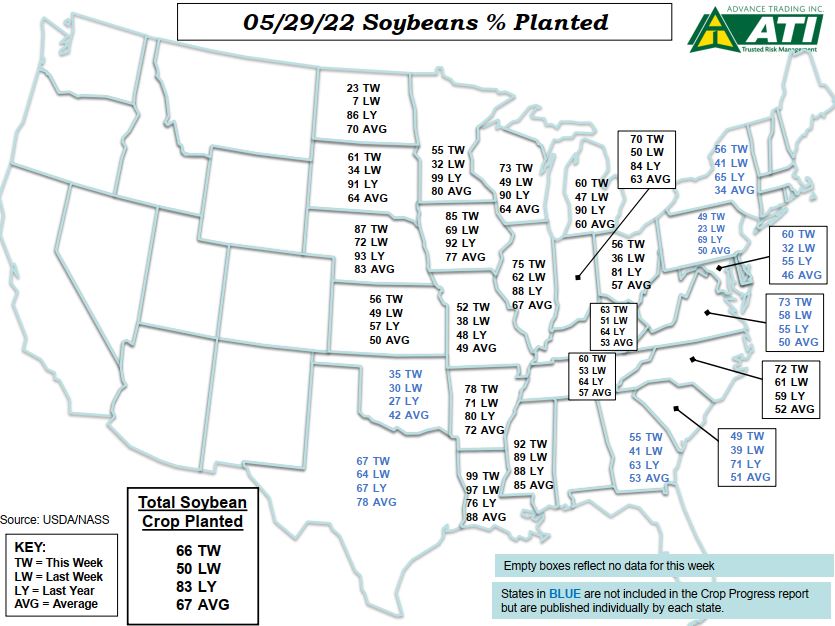
NASS reported that good planting progress was made as of May 29th with corn and soybean planting just about up to the 5-year average. North Dakota remains the standout where acres may be lost to prevent plant as crop insurance deadlines have been passed.
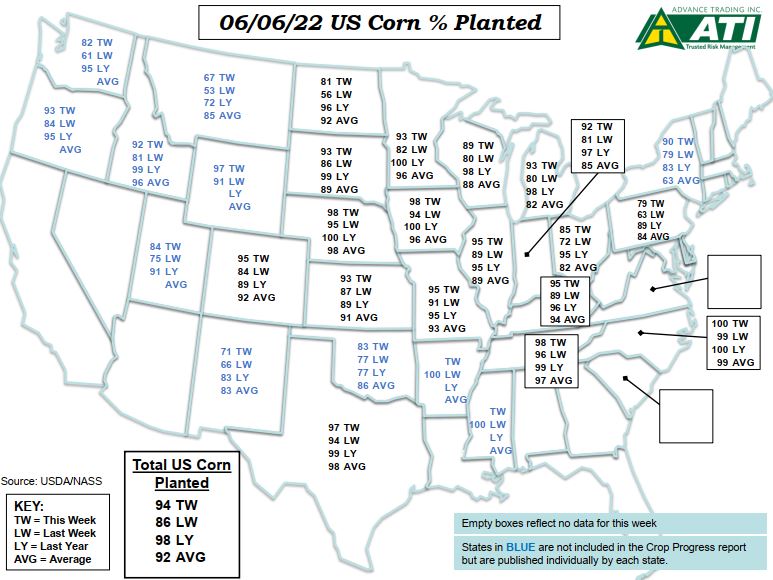
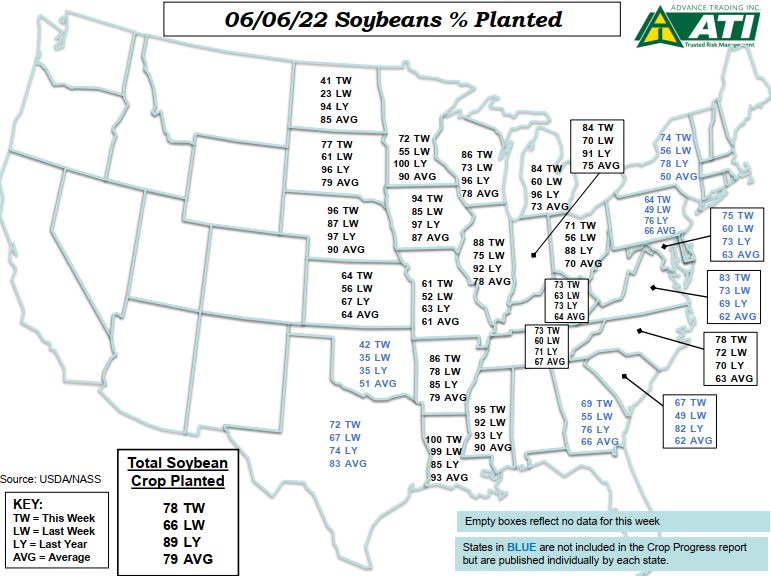
The corn crop is 86% planted vs. 94% last year and 87% on average. The soybean crop is 66% planted vs. 83% last year and 67% on average.
| Conditions (Good + Excellent) | |
| Winter Wheat Conditions | G/E: 29% TW vs. 28% LW, 48% LY |
| Crop Progress Summary | |
| Corn Planted | 86% TW vs. 72% LW, 94% LY, 87% AVG |
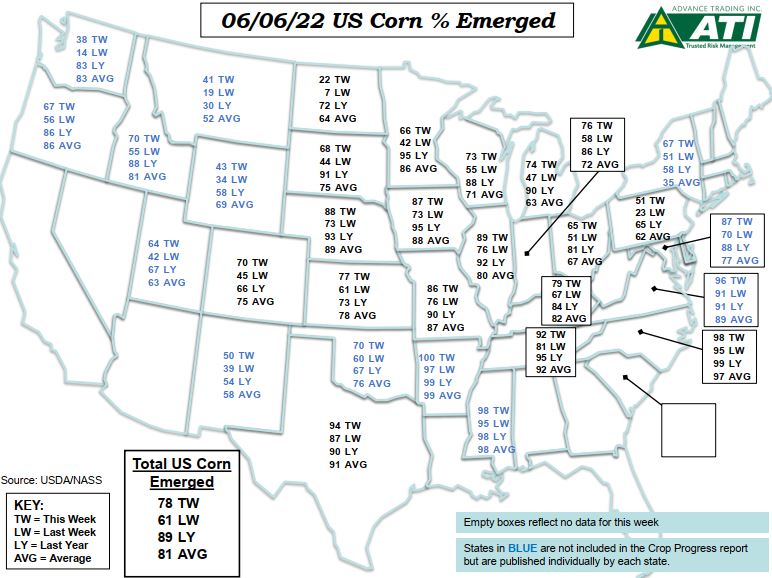
| Corn Emerged | 61% TW vs. 39% LW, 79% LY, 68% AVG |
| Soybean Planted | 66% TW vs. 50% LW, 83% LY, 67% AVG |
| Soybean Emerged | 39% TW vs. 21% LW, 59% LY, 43% AVG |
| Milo Planted | 40% TW vs. 33% LW, 40% LY, 43% AVG |
| Winter Wheat Headed | 72% TW vs. 63% LW, 77% LY, 76% AVG |
| Spring Wheat Planted | 73% TW vs. 49% LW, 97% LY, 92% AVG |
| Spring Wheat Emerged | 42% TW vs. 29% LW, 78% LY, 69% AVG |
| Source: USDA/NASS |
Read the complete NASS report here
Graphics courtesy of Advance Trading Inc

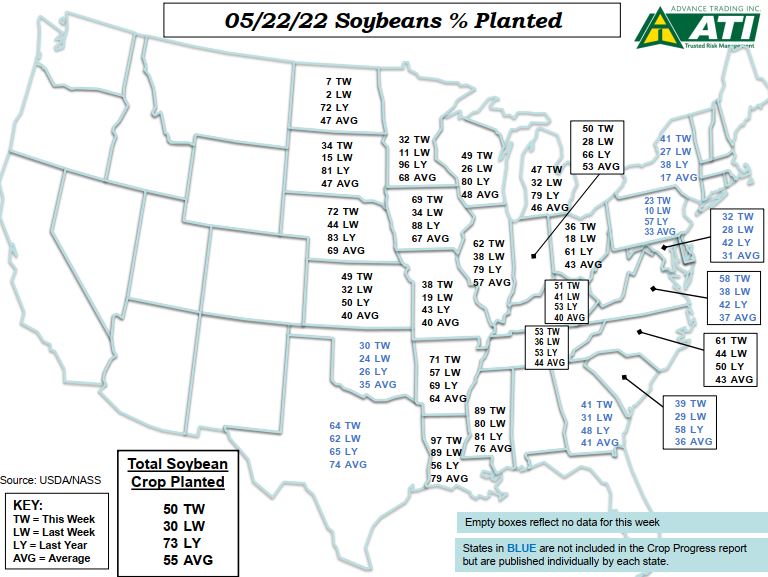
Corn and soybean planting made big strides again last week. NASS reported that corn planting is 72% complete vs. 89% last year and 79% on average. Soybean planting is 39% complete vs. 61% last year and 51% on average.
| Conditions (Good + Excellent) | |
| Winter Wheat Conditions | G/E: 28% TW vs. 27% LW, 47% LY |
| Crop Progress Summary | |
| Corn Planted | 72% TW vs. 49% LW, 89% LY, 79% AVG |
| Corn Emerged | 39% TW vs. 14% LW, 61% LY, 51% AVG |
| Soybean Planted | 50% TW vs. 30% LW, 73% LY, 55% AVG |
| Soybean Emerged | 21% TW vs. 9% LW, 38% LY, 26% AVG |
| Milo Planted | 33% TW vs. 26% LW, 32% LY, 35% AVG |
| Winter Wheat Headed | 63% TW vs. 48% LW, 65% LY, 65% AVG |
| Spring Wheat Planted | 49% TW vs. 39% LW, 93% LY, 83% AVG |
| Spring Wheat Emerged | 29% TW vs. 16% LW, 63% LY, 50% AVG |
| Source: USDA/NASS |
Read the complete NASS report here
Graphics courtesy of Advance Trading Inc.
NASS reported good corn planting progress this week however the pace remains well behind average. The good news is that corn planting is ahead of the historic slow years of 2013 and 2019. As of Sunday, corn planting was reported to be 49% complete vs. 78% last year and 67% on average.
Soybean planting is also well off the pace at 30% complete this week vs. 58% last year and 39% on average.
| Conditions (Good + Excellent) | |
| Winter Wheat Conditions | G/E: 27% TW vs. 29% LW, 48% LY |
| Crop Progress Summary | |
| Corn Planted | 49% TW vs. 22% LW, 78% LY, 67% AVG |
| Corn Emerged | 14% TW vs. 5% LW, 38% LY, 32% AVG |
| Soybean Planted | 30% TW vs. 12% LW, 58% LY, 39% AVG |
| Soybean Emerged | 9% TW vs. 3% LW, 19% LY, 12% AVG |
| Milo Planted | 26% TW vs. 22% LW, 26% LY, 30% AVG |
| Winter Wheat Headed | 48% TW vs. 33% LW, 51% LY, 53% AVG |
| Spring Wheat Planted | 39% TW vs. 27% LW, 83% LY, 67% AVG |
| Spring Wheat Emerged | 16% TW vs. 9% LW, 44% LY, 30% AVG |
| Source: USDA/NASS |
Read the complete NASS report here
Graphics courtesy of Advance Trading Inc


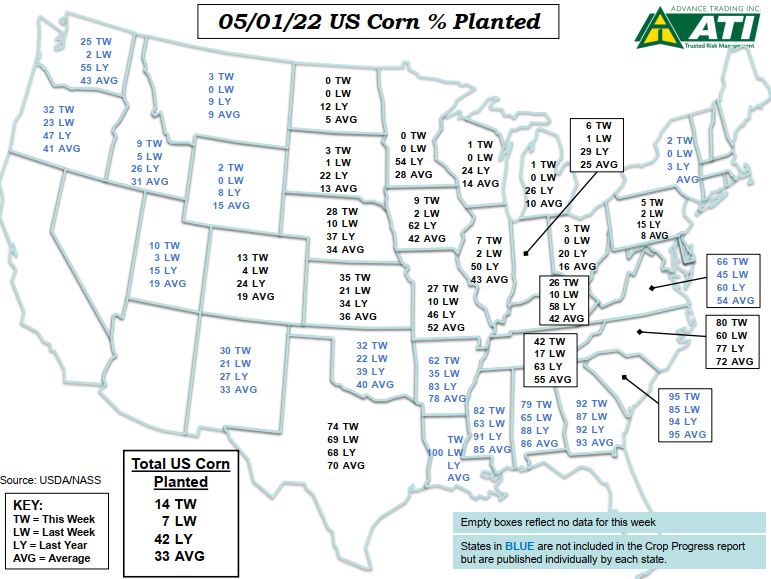
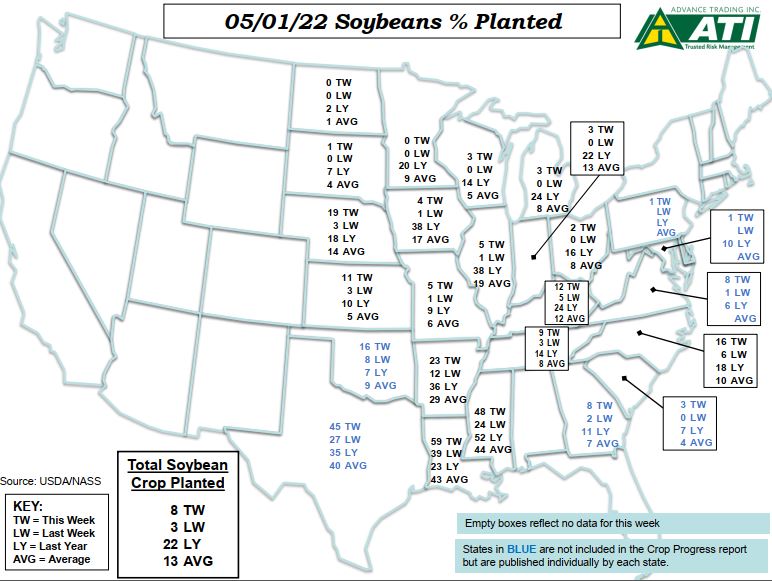
NASS reports corn and soybean planting progress continue to lag far behind the average pace. As of Sunday May 8th, corn planting is report 22% complete vs. 64% last year and 50% on average. Soybean planting is reported 12% complete vs. 39% last year and 24% on average. The forecast looks favorable for good progress over the next two weeks which is pressuring grain values.
| Conditions (Good + Excellent) | |
| Winter Wheat Conditions | G/E: 29% TW vs. 27% LW, 49% LY |
| Crop Progress Summary | |
| Corn Planted | 22% TW vs. 14% LW, 64% LY, 50% AVG |
| Corn Emerged | 5% TW vs. 3% LW, 18% LY, 15% AVG |
| Soybean Planted | 12% TW vs. 8% LW, 39% LY, 24% AVG |
| Soybean Emerged | 3% TW vs. (NA)% LW, 9% LY, 4% AVG |
| Milo Planted | 22% TW vs. 20% LW, 22% LY, 26% AVG |
| Winter Wheat Headed | 33% TW vs. 23% LW, 36% LY, 40% AVG |
| Spring Wheat Planted | 27% TW vs. 19% LW, 67% LY, 47% AVG |
| Spring Wheat Emerged | 9% TW vs. 5% LW, 27% LY, 15% AVG |
| Source: USDA/NASS |
Read the complete NASS report here
Graphics courtesy of Advance Trading Inc.
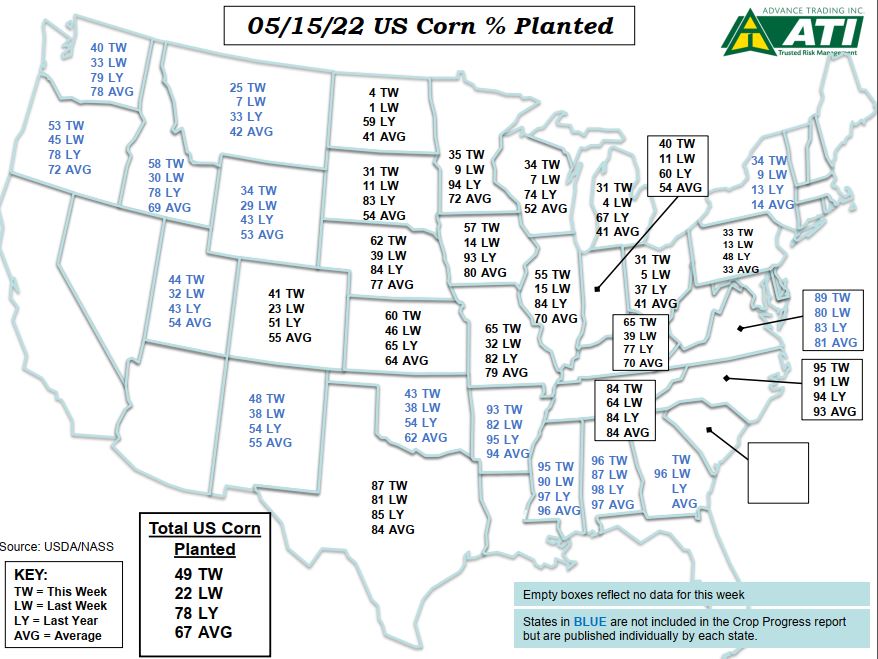
While there was some corn planting reported last week, progress remains well behind the average pace and far behind last year’s rapid pace. Corn planting is 14% complete this week which was a bit below the expectations vs. last year at 42% and the 5-year average of 33% complete.
Soybean planting is also off to a slow start at 8% complete this week vs. 22% last year and 13% on average.
| Conditions (Good + Excellent) | |
| Winter Wheat Conditions | G/E: 27% TW vs. 27% LW, 48% LY |
| Crop Progress Summary | |
| Corn Planted | 14% TW vs. 7% LW, 42% LY, 33% AVG |
| Corn Emerged | 3% TW vs. 2% LW, 7% LY, 6% AVG |
| Soybean Planted | 8% TW vs. 3% LW, 22% LY, 13% AVG |
| Milo Planted | 20% TW vs. 19% LW, 20% LY, 23% AVG |
| Winter Wheat Headed | 23% TW vs. 11% LW, 26% LY, 29% AVG |
| Spring Wheat Planted | 19% TW vs. 13% LW, 46% LY, 28% AVG |
| Spring Wheat Emerged | 5% TW vs. 2% LW, 13% LY, 7% AVG |
| Source: USDA/NASS |
Read the complete NASS report here
Graphics courtesy of Advance Trading Inc.
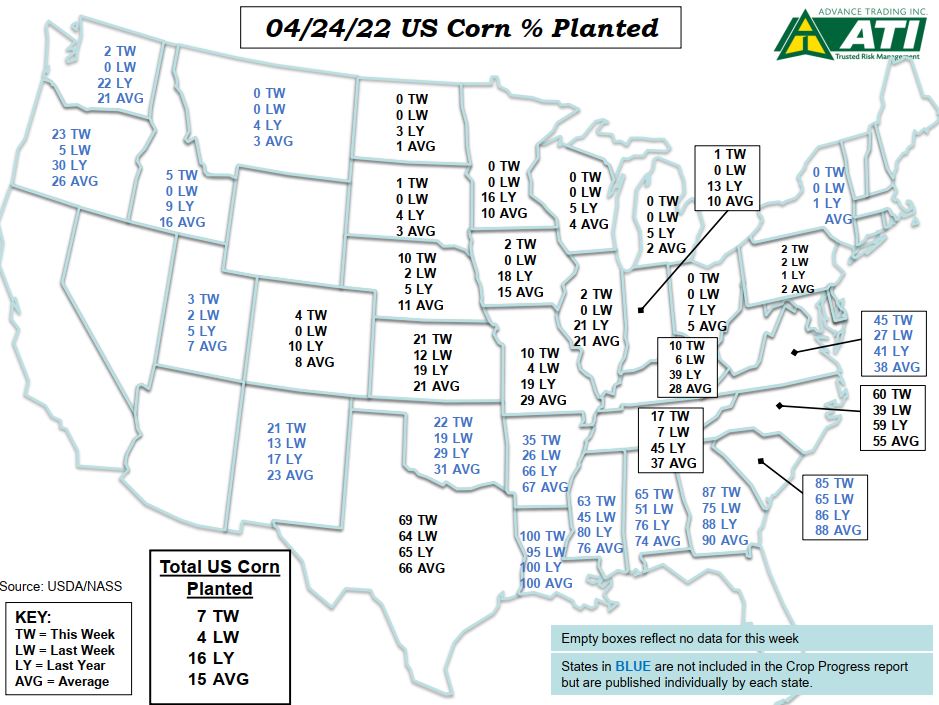
The gap between average corn planting progress and this year widened as there was little planting accomplished reported in this week’s Crop Progress Report. Nebraska is the only major corn producing state that is near normal in corn planting progress.
| Conditions (Good + Excellent) | |
| Winter Wheat Conditions | G/E: 27% TW vs. 30% LW, 49% LY |
| Crop Progress Summary | |
| Corn Planted | 7% TW vs. 4% LW, 16% LY, 15% AVG |
| Corn Emerged | 2% TW vs. (NA)% LW, 3% LY, 3% AVG |
| Soybean Planted | 3% TW vs. 1% LW, 7% LY, 5% AVG |
| Milo Planted | 19% TW vs. 17% LW, 18% LY, 21% AVG |
| Winter Wheat Headed | 11% TW vs. 7% LW, 16% LY, 19% AVG |
| Spring Wheat Planted | 13% TW vs. 8% LW, 27% LY, 15% AVG |
| Spring Wheat Emerged | 2% TW vs. (NA)% LW, 7% LY, 4% AVG |
| Source: USDA/NASS |
Read the complete NASS report here
Graphics courtesy of Advance Trading Inc.

The 2022 crop is off to a slow start due to cool, wet weather. National corn planting is 4% complete vs. 7% last year and 6% on average.
| Conditions (Good + Excellent) | |
| Winter Wheat Conditions | G/E: 30% TW vs. 32% LW, 53% LY |
| Crop Progress Summary | |
| Corn Planted | 4% TW vs. 2% LW, 7% LY, 6% AVG |
| Soybean Planted | 1% TW vs. (NA)% LW, 3% LY, 2% AVG |
| Milo Planted | 17% TW vs. 14% LW, 15% LY, 19% AVG |
| Winter Wheat Headed | 7% TW vs. 5% LW, 9% LY, 12% AVG |
| Spring Wheat Planted | 8% TW vs. 6% LW, 18% LY, 9% AVG |
| Source: USDA/NASS |
Read the complete NASS report here
Graphics courtesy of Advance Trading, Inc